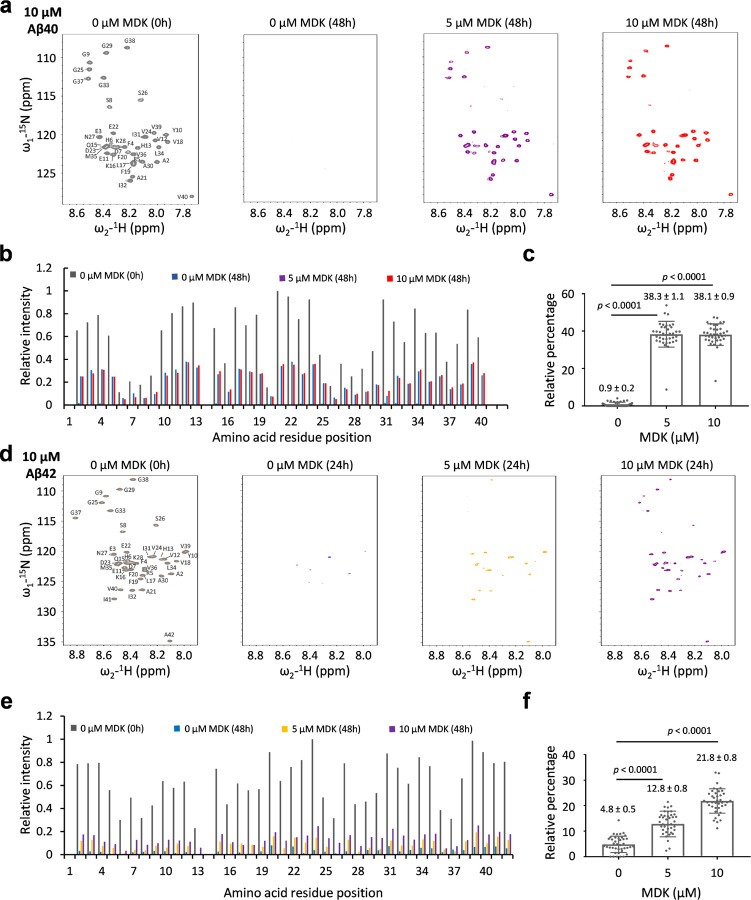
Figure 2. MDK rescues NMR signals of Aβ peptides.
a, 1H-15N HSQC spectra of Aβ40 (10 μM) with MDK concentrations of 0, 5, or 10 μM in a buffer containing of 50 mM Tris buffer, pH 7.5. The spectra were collected prior to incubation (the left panel) and after 48 h incubation (the right three panels). b, Relative cross peak intensities for each residue, excluding D1 and H14. The intensities were normalized with the maximum intensity set to 1. c, Relative percentage of Aβ40 intensities after 48 h incubation compared to those before incubation. The percentage values were calculated for each residue and then averaged to show the mean and standard error of the mean (SEM). Statistical significance is analyzed by two-tailed Student’s t-test. d-f, The HSQC spectra of Aβ42 under similar conditions as Aβ40, but with the incubation time shortened to 24 h. Statistical significance is analyzed by two-tailed Student’s t-test.

