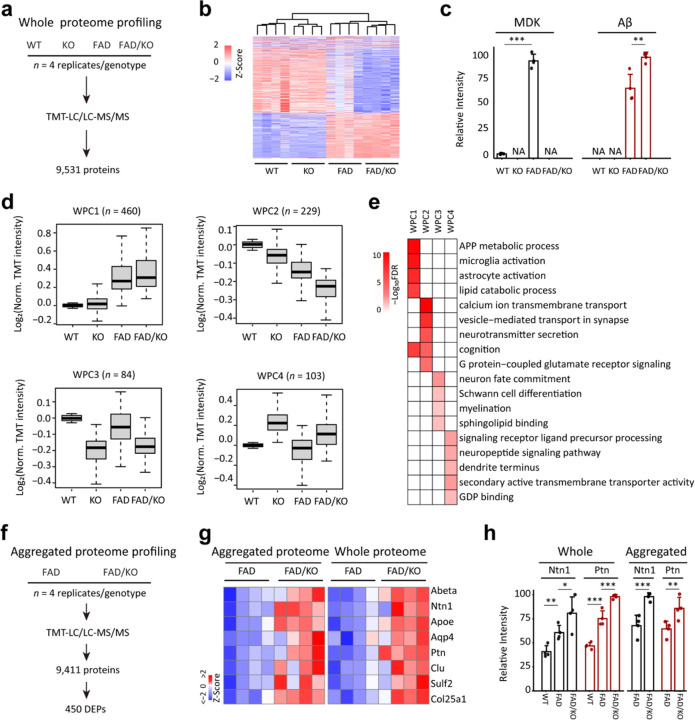
Figure 4. Brain tissue proteomics reveals Mdk knockout causes the accumulation of Aβ and Aβ-correlated proteins, along with microglia activation in FAD.
a, Workflow of whole proteome analysis of the brain cortical region for four mouse genotypes (12-month-old, n = 4 replicates for each genotype). b, Clustering of the whole proteome to show the grouping of four genotypes using DEPs. c, MDK and Aβ levels extracted from the whole proteome analysis. d, Four major clusters of DEPs defined by the WGCNA program. The intensity of each protein is log transformed followed by Z score analysis. e, Enriched pathways in the WPC proteins by Fisher’s exact test. f, Workflow of profiling the aggregated proteome in FAD and FAD/KO mice (12-month-old, n = 4 replicates). g, Heatmap for selected proteins shared by the whole proteome and aggregated proteome. The data are shown after normalization by z score transformation. h, Ntn1 and Ptn protein levels selected from the whole and aggregated proteome analyses. Statistical significance is determined by a two-tailed Student’s t-test, and the results are shown as mean ± SEM. *: P < 0.05; **: P < 0.01; and ***: P < 0.001.

