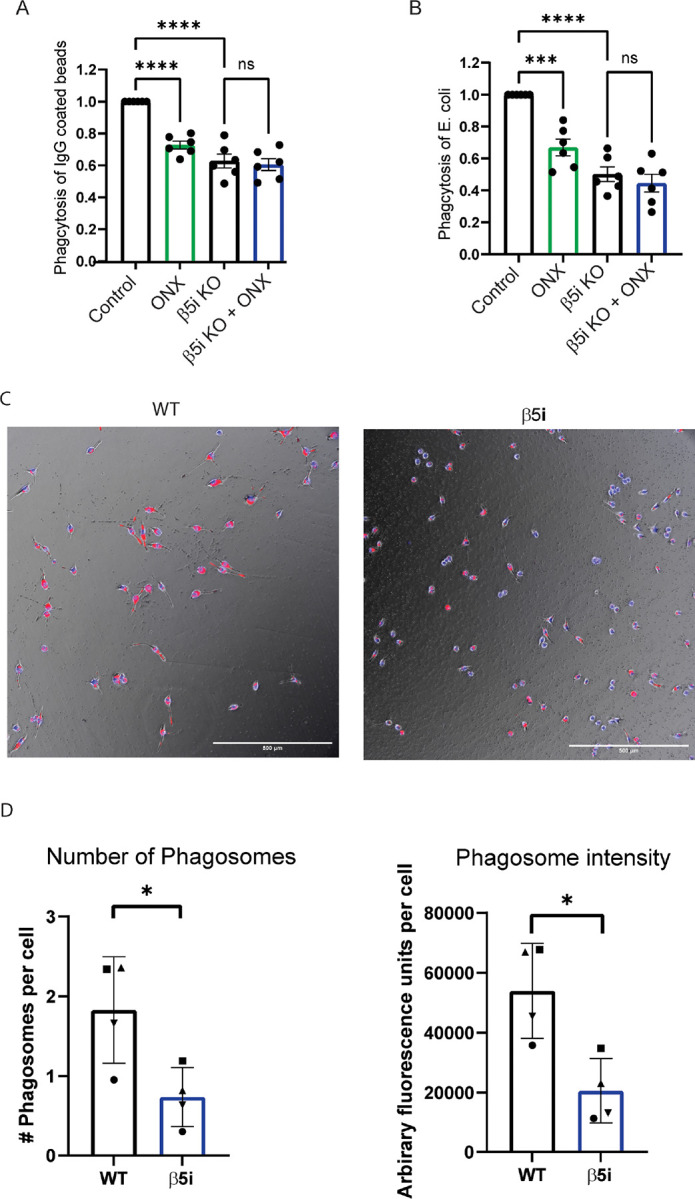
Figure 2. Phagocytosis is impaired by immunoproteasome inhibition.

WT and β5i KO BV-2 cells were treated for 24 hours with ONX-0914 prior to measuring phagocytosis by flow cytometry. To adjust for background, control cells that were not exposed to fluorescent beads were used for each experiment A. Phagocytosis of IgG-coated latex beads was significantly different between groups ([F(3,10)=7.68, p=.005). Post hoc analysis revealed that treatment with ONX-0914 resulted in significantly decreased phagocytosis compared to control (p=.032). B. Phagocytosis of eGFP-expressing E. coli was measured after a 30 minute incubation by quantifying the percentage of cells that were GFP positive. Flow cytometry analysis revealed a significant difference between treatment groups ([F(3,18)=39.23], p<.001). Treatment with ONX-0914 resulted in significantly decreased phagocytosis compared to control (p<.001). C. Example images of pHrodo IgG mediated phagocytosis uptake at end of 2-hour imaging in WT (left) and β5i KO BV-2 cells (right). Red fluorescence signifies pHrodo bead uptake. Blue fluorescence signifies Hoechst staining of cell nuclei. Scale bar is 500μm. D. Number of phagosomes per cell and mean phagosome signal intensity was significantly decreased in β5i KO BV-2 cells compared to WT. Reported as mean value per experiment. Error bars demonstrate SEM. Phagosome count per cell statistical analysis was performed with unpaired t-test, *p<0.0289. Mean phagosome fluorescence intensity analysis was performed with unpaired t-test, *p<0.0132.
