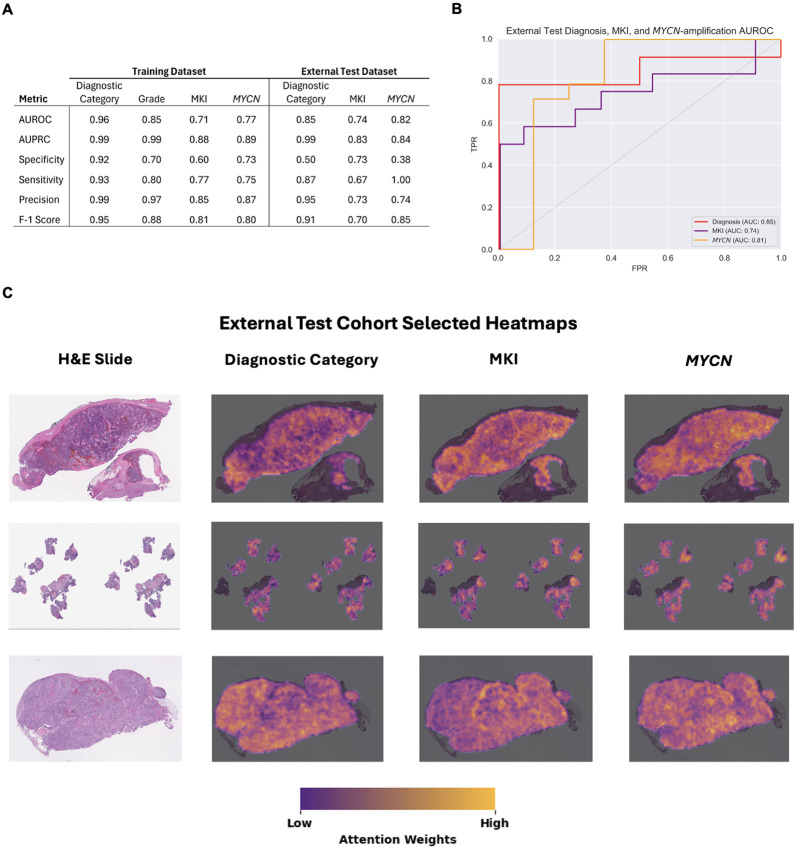
Figure 2.
Model performance and explainability. (A) Performance metrics for training and external test models. (B) AUROC plots for the external test models. (C) Explainability heatmaps generated with GradCAM. Yellow regions were highly weighted and informative to the model while dark purple regions corresponded to low weights in generating predictions. Abbreviations: AUROC, Area Under the Receiver Operator Curve; AUPRC, Area Under the Precision Recall Curve.

