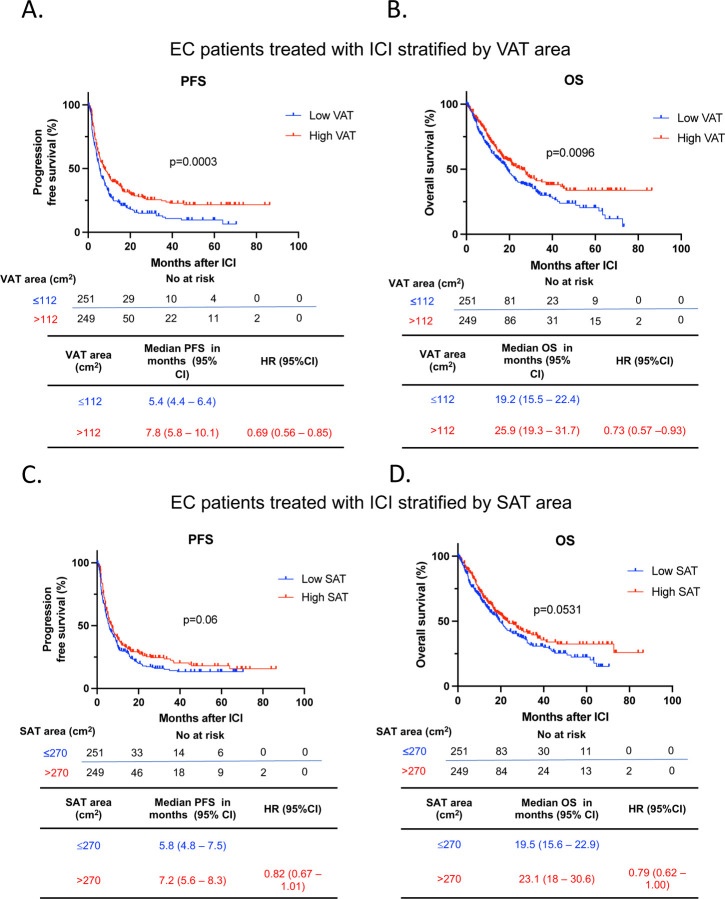
Figure 4. Survival outcomes after ICI in EC stratified by VAT and SAT area.
Kaplan-Meier curves for (A) PFS and (B) OS in patients with EC following ICI treatment stratified by low and high VAT area (n=500) (Low VAT area: ≤112 cm2 in blue; High VAT area: >112 cm2 in red). Kaplan-Meier curves for (C) PFS and (D) OS in patients with EC following ICI treatment stratified by low and high SAT area (Low SAT area: ≤270 cm2 in blue; High SAT area: >270 cm2 in red) (n=500). Patients were categorized as low or high VAT /SAT based on the median SAT and VAT of the entire cohort. The P values in the PFS and OS plots were calculated using a log-rank test. BMI, body mass index; OS, overall survival; PFS, progression free survival; EC, endometrial cancer; ICI, immune checkpoint inhibitor; VAT, visceral adipose tissue; SAT, subcutaneous adipose tissue; HR, Hazard ratio; CI, confidence interval

