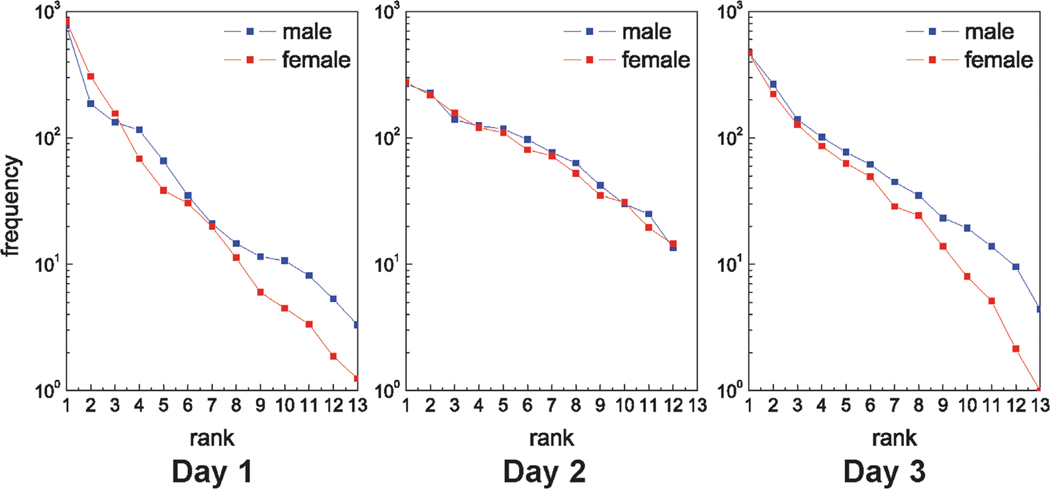
Figure 3. Contact frequency.
Semi-log plots of the mean frequency of children’s social contacts by ordinal rank. Rank 1 indicates the most contacted peer, Rank 2 the second-most, through the least-most contacted peer. On Day 1 and Day 3, 14 children were in attendance and each child had 13 peers. On Day 2, 13 children were in attendance and each child had 12 peers. Mean contact frequency by rank is displayed for males and females. Both males and females consistently show levels of social contact with their most contacted peers that are ten to hundreds of time higher than levels of contact with their least contacted peers.

