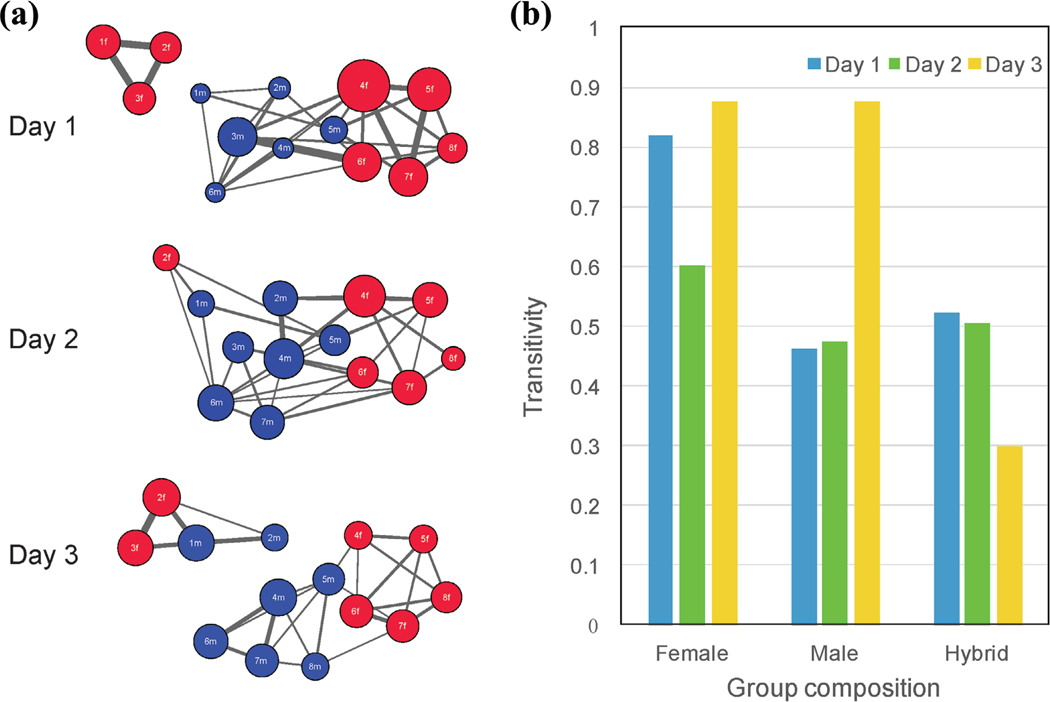
Figure 4. Social networks and transitivity.
(a) Red nodes (circles) represent female children and blue nodes represent male children. Node diameter is proportional to the duration of contact with all other children. Edges (lines between circles) connect children when the contact frequency between those two children was greater than the mean contact frequency of all pairs of children on a given day. The width of edges connecting circles is proportional to the duration of contact between the two connected children. Males and females appear to form male-only, female-only, and mixed groups. (b) Transitivity occurs when children who share a social contact are themselves in social contact. To quantify transitivity, each day’s network is considered as a set of triplets of three children. A triplet is composed of three nodes with two or three edges connecting the nodes. The proportion of three-edged triplets indexes transitivity. Transitivity is shown for all-female, all-male, and hybrid (mixed) triplets for each day of observation.

