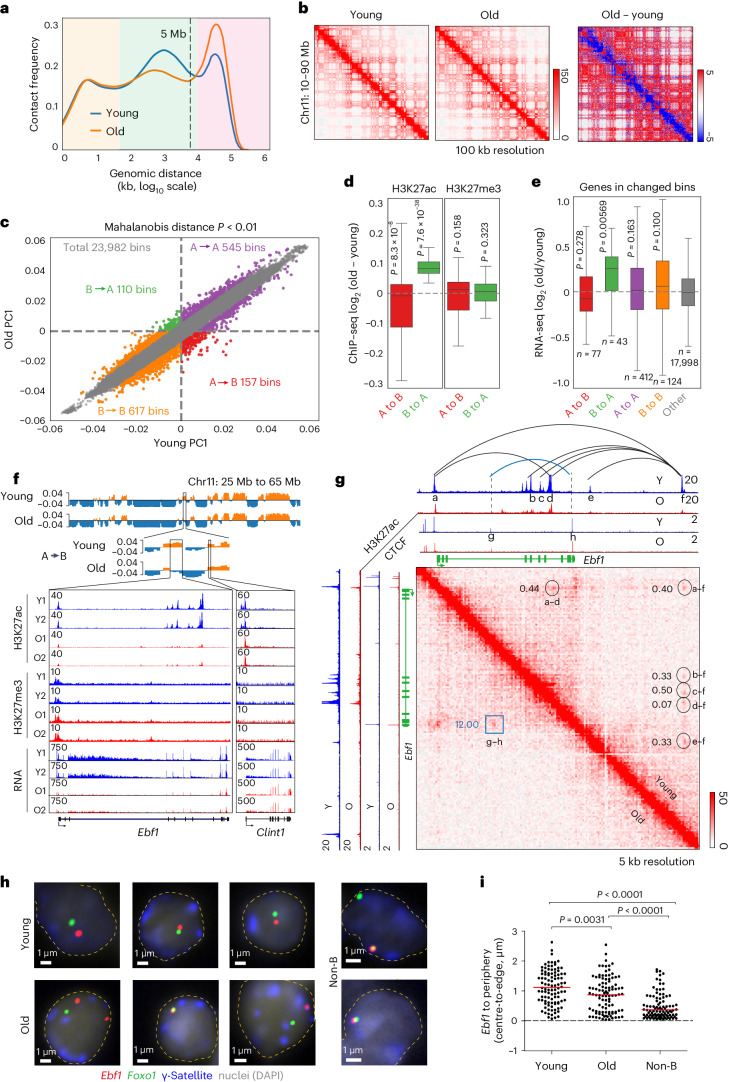
Fig. 1. Age-associated chromatin compartment changes in murine bone marrow B cell progenitors.
a, Combined Hi-C contact linear genomic distances density plots from two replicates of young and old pro-B cells. Colour shading refers to compartments (pink), TADs and loops (green), and close interactions (yellow). b, Example of Hi-C contact heatmaps, visualized with Juicebox using Coverage (sqrt) normalization. Difference heatmap (right) shows regions with increased (red) and decreased interactions (blue) in old pro-B cells. c, PC1 of young and old pro-B cells from Hi-C compartment analysis. Numbers of significantly changed euchromatic (A) and heterochromatic (B) bins of 100 kb are indicated in each quadrant. Significantly changed bins were obtained using a two-pass MD method with a one-sided chi-squared test P < 0.01. d, Difference of aggregate H3K27ac and H3K27me3 (n = 2) signals within significantly switched bins identified in c. e, Differential expression (n = 4) for genes associated with each category identified in c from RNA-seq analysis. The top and bottom of each box (in d and e) represents the 75th and 25th percentile, respectively, with a line at the median. Whiskers extend by 1.5× the interquartile range. P values were determined by two-sided Wilcoxon signed-rank test. f, Chromatin state of Ebf1 locus in young and old pro-B cells. Top tracks show Hi-C compartment PC1, with orange indicating compartment A and blue indicating compartment B. Lower tracks show normalized ChIP–seq and RNA-seq tracks. Clint1 (right) serves as a control gene located in compartment A that is unaffected by age. g. Hi-C heatmaps of the Ebf1 locus. Interactions with greater than twofold change in old pro-B cells are marked by black circles/arcs (reduced) or the blue square/arc (increased). Numbers represent the ratio of Hi-C PETs in old pro-B cells compared with young pro-B cells. h, Nuclear positioning assayed by FISH. Representative nuclei from young and old pro-B cells and non-B cells from Rag2−/− mice are shown. Probe colours are as indicated. Dashed lines delineate the nuclear periphery. i, Distance between Ebf1 locus and nuclear periphery in pro-B cells and non-B cells (n = 100) is shown. The red line indicates the median value; P values based on unpaired two-sided t-tests.

