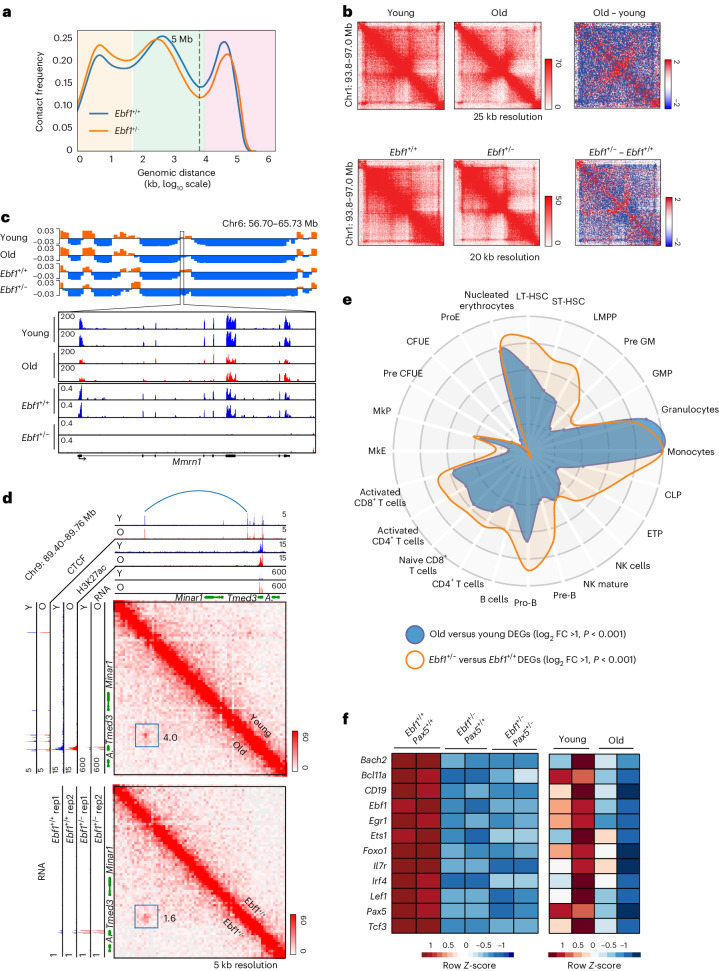
Fig. 2. Reduced Ebf1 expression in pro-B cells partially mimics ageing phenotype.
a, Combined Hi-C contact linear genomic distances density plots from two replicates of Rag2-deficient Ebf1+/+ and Ebf1+/− pro-B cells. Genomic distances are shaded as follows: compartments (pink) TADs and loops (green) and close interactions (yellow). b, Similar TAD changes in old versus young and Ebf1+/− versus Ebf1+/+ pro-B cells (chromosomal region as indicated). Heatmaps in each kind of pro-B cells are shown with difference maps on the right. Blue and red colours represent reduced or increased interactions, respectively, in old or Ebf1+/− pro-B cells. c, Similar compartment switching in old versus young and Ebf1+/− versus Ebf1+/+ pro-B cells at Mmrn1 gene locus. Top tracks show Hi-C PC1, with orange indicating compartment A and blue indicating compartment B. Lower tracks show normalized RNA-seq tracks across the Mmrn1 locus. d, Similar loop changes in old versus young and Ebf1+/−versus Ebf1+/+ pro-B cells. Hi-C heatmaps for a region of chromosome 9 with increased interactions (blue arc) in old and Ebf1+/− pro-B cells. Numbers adjacent to the blue square represent the ratios of Hi-C PETs in old compared with young (top) pro-B cells and in Ebf1+/− compared with Ebf1+/+ pro-B cells (bottom). RNA-seq analysis in young/old and Ebf1+/+/Ebf1+/− pro-B cells are shown alongside. e, CellRadar (https://karlssong.github.io/cellradar/) plot derived from transcriptional changes identified in comparison of young and old (Rag2−/−) pro-B cells (n = 4) and Ebf1+/+ and Ebf1+/− pro-B cells (n = 2). DEGs, differentially expressed genes; FC, fold change; NK, nature killer cells; ProE, proerythroblast; CFUE, colony forming unit-erythroid; Pre CFUE, colony forming unit-erythroid restricted precursor; MkP, megakaryocyte progenitor; MkE, megakaryocyte-erythroid; ETP, early T cell precursor; CLP, common lymphoid progenitor; GMP, granulocyte-monocyte progenitor, pre GM, pre-granulocyte macrophage; LMPP, lympho-myeloid primed progenitor; ST-HSC, short-term hematopoietic stem cell; LT-HSC, long-term hematopoietic stem cell. f, Expression levels of key B cell genes in pro-B cells of indicated genotypes and young and old (Rag2−/−) pro-B cells measured by RNA-seq. Colours indicate z-score normalized gene expression levels.

