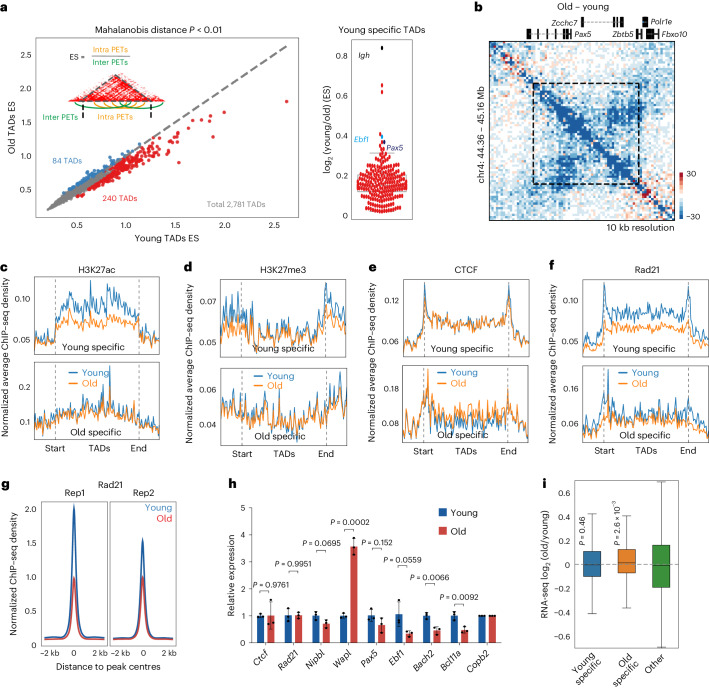
Fig. 3. Age-associated changes in TADs in pro-B cells.
a, The scatter plot on the left displays a quantitative comparison of TAD strength derived from Hi-C data of young and old Rag2−/− pro-B cells. Each dot in the plot represents one TAD, and TAD strength is represented as the ES, calculated as indicated. TADs showing increased or decreased interactions with age are coloured blue (old specific) or red (young specific), respectively. Dot plot represents reduced TADs in old pro-B cells. TADs encompassing Igh, Ebf1 and Pax5 loci are indicated. Significantly changed TADs were obtained using a two-pass MD method with a one-sided chi-squared test, P < 0.01. b, Difference heatmap showing reduced TAD formation covering the Pax5 gene locus in aged pro-B cells. c–f, Aggregation analysis of H3K27ac (c), H3K27me3 (d), CTCF (e) and Rad21 (f), ChIP–seq signal densities at significantly decreased (n = 240, young-specific group) and increased (n = 84, old-specific group) TADs identified in a. g, Aggregation analysis of Rad21 ChIP–seq signal densities around peak centre. Rep1 and Rep2 represent two biological experiments. h, Quantitative RT–PCR validation of RNA-seq data (n = 3). Data are normalized to Copb2 and presented as mean ± standard error of the mean, with each replicate shown as a dot. Unpaired two-sided t-test was used to determine P values. i, Distribution of expression levels for the genes located in significantly changed TADs (n = 4). The top and bottom of each box represents 75th and 25th percentile, respectively, with a line at the median. Whiskers extend by 1.5× the interquartile range. P values were determined by two-sided Wilcoxon signed-rank test.

