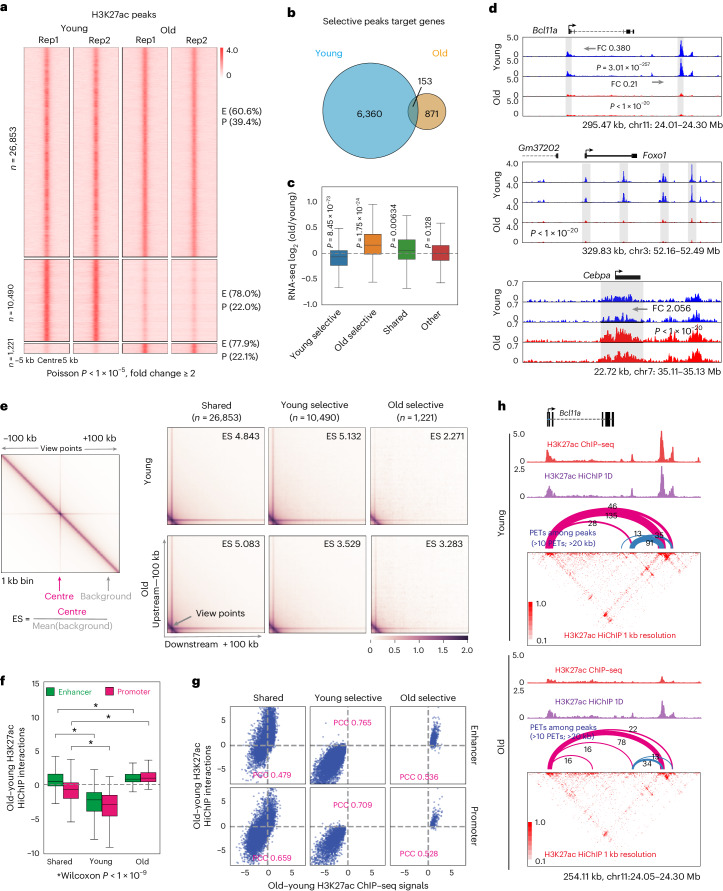
Fig. 4. H3K27ac-mediated chromatin reorganization during ageing.
a, Changes in H3K27ac were identified from ChIP–seq in young and old pro-B cells (n = 2). Rep1 and Rep2 represent two biological experiments. H3K27ac peaks within 2 kb of the TSS are labelled as promoters (P), others are labelled as enhancers (E). Top, unchanged peaks (shared); middle, peaks that were reduced in old pro-B cells (young selective); and bottom, peaks that were increased in old pro-B cells (old selective). b, Age-associated H3K27ac peaks were annotated to genes; Venn diagram shows overlap between genes containing young- or old-selective H3K27ac peaks. c, Expression levels (n = 4) of genes containing each H3K27ac peak category. The ‘Other’ category includes genes that are expressed but not annotated to identified H3K27ac peaks. d, Genome browser tracks of genes containing young (Bcl11a and Foxo1) and old-selective (Cebpa) H3K27ac peaks. FC, fold change of indicated H3K27ac peak. P values were determined by one-sided Poisson test. e, Aggregation analysis of H3K27ac HiChIP data (n = 2) with H3K27ac peaks identified in a. The ES for each H3K27ac peak was calculated as shown. The right panels display the average ES for each category of H3K27ac peaks. f, H3K27ac HiChIP interaction (n = 2) differences for categories identified in part ‘a’ separated by location of H3K27ac at promoter or enhancer. g, Correlation between changes in H3K27ac ChIP–seq signal and H3K27ac HiChIP interaction strength for peaks identified in a. PCC, Pearson correlation coefficient. h, Heatmaps of H3K27ac HiChIP interactions in the Bcl11a locus in young (upper) and old (lower) pro-B cells. The pink arches represent interactions from the Bcl11a promoter. Strength of interactions are denoted by thickness of arches. Top tracks show H3K27ac peaks obtained from ChIP–seq (red) or HiChIP (purple). The top and bottom of each box (in c and f) represent 75th and 25th percentile, respectively, with a line at the median. Whiskers extend by 1.5× the interquartile range. P values were determined using two-sided Wilcoxon signed-rank test; asterisks signify P < 1 × 10⁻⁹ (Methods).

