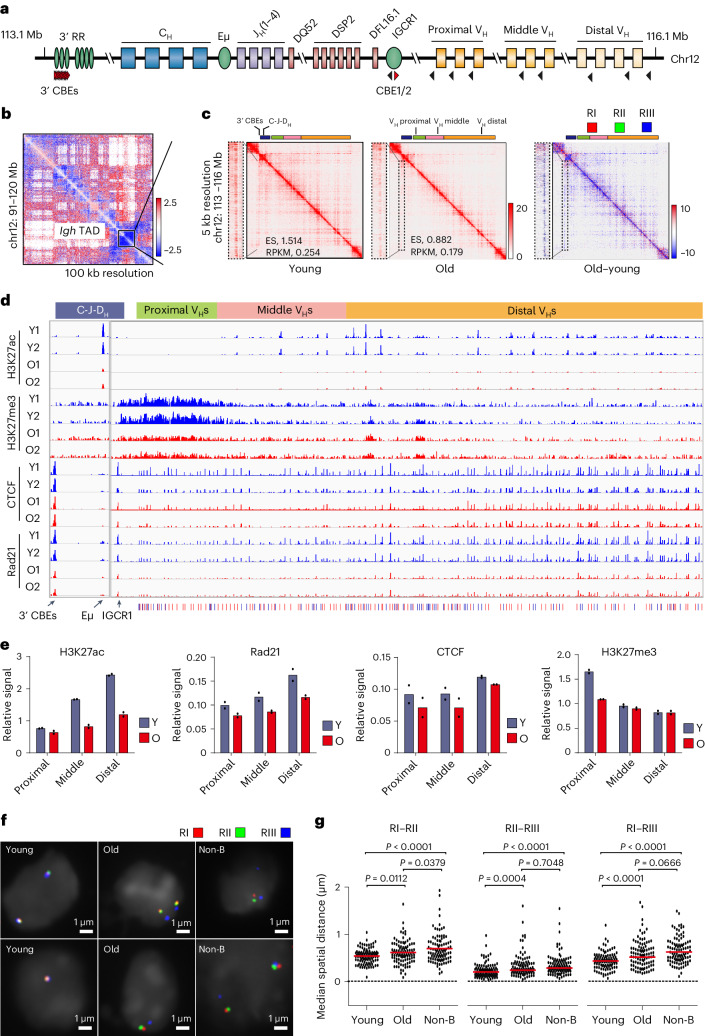
Fig. 5. Age-associated changes in chromatin structure at the Igh locus.
a, Schematic representation of the mouse Igh locus. Regulatory elements are displayed as ovals. Black and red triangles represent CBEs with opposite orientations. b, Difference Hi-C heatmap showing a part of chromosome 12; Igh TAD is boxed. c, Contact frequency heatmaps of the Igh TAD in young and old pro-B cells. A stripe from 3′ CBEs across the Igh locus is indicated by dashed box and zoomed in on the left side of each heatmap. Schematics on top represent the locus to scale. Coloured sections represent 3′ Igh domain (dark blue), proximal VH genes (green), middle VH genes (pink) and distal VH genes (yellow). A difference map for the same region is shown on the right. The red (RI), green (RII) and blue (RIII) bars above the difference map indicate locations of bacterial artificial chromosome (BAC) probes used for FISH assays in f and g. RPKM, reads per kilobase per million mapped reads. d, Age-dependent histone modifications and CTCF and Rad21 binding at the Igh locus. Tracks from replicate young and old pro-B cell samples are shown. e, Quantification of H3K27ac, Rad21, CTCF and H3K27me3 ChIP–seq (n = 2) signals in the 2 Mb region of the Igh locus that contains VH gene segments. Proximal, middle and distal refer to locations relative to the 3′ end of the locus (C-J-DH) in part d. ‘Relative signal’ represents read counts per million (CPM) of each region relative to total reads. Bar graph represents the mean of two replicate experiments, with each replicate shown as a dot. f,g, RI, II and III BAC probes (part b) were used in FISH with young and old Rag2−/− pro-B cells. Representative nuclei and probe colours are as indicated (f). Dot plots of spatial distances between indicated probes (n = 100) (g). Non-B cells represent Rag2−/− bone marrow cells depleted of CD19+ pro-B cells. Unpaired two-sided t-test was used for g, with P values indicated.

