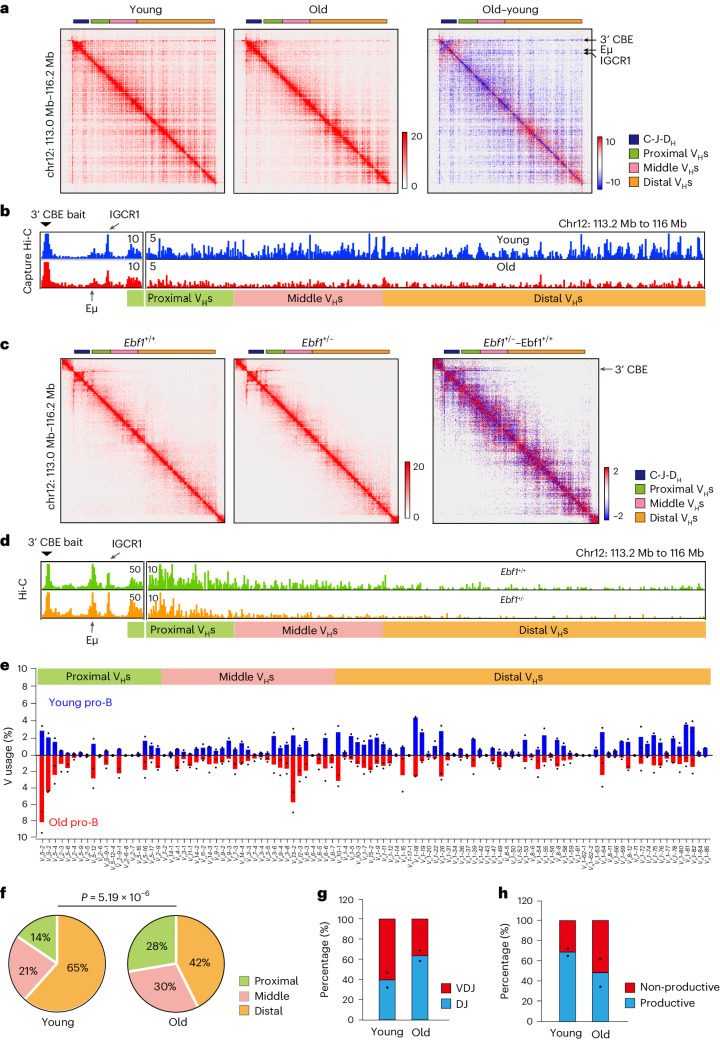
Fig. 6. Functional consequences of age-associated impairment of Igh locus contraction.
a,c, Contact frequency heatmaps of capture Hi-C (a) or Hi-C (c) showing the Igh TAD in young and old pro-B cells (a) or Ebf1+/+ and Ebf1+/− pro-B cells (c). Difference maps for the same region are shown on the right; regions with increased and decreased interactions in old or Ebf1+/− pro-B cells are coloured red and blue, respectively. Schematics on top represent the Igh locus to scale; colours represent different parts of the locus as indicated to the right of the figure. b,d, Virtual 4C tracks were derived from capture Hi-C in young and old (b) or Hi-C in Ebf1+/+ and Ebf1+/− (d) pro-B cells using 3′ CBEs as the bait. Specific interactions with Eμ and IGCR1 appear as peaks (left); widespread interactions with different parts of the VH regions are shown. e, Rearrangement frequencies (n = 2) of all VH gene segments in young and old pro-B cells from C57BL/6J mice. f, Pie graph showing differential proximal, middle and distal VH gene utilization in young and old pro-B cells. A one-sided chi-squared test was used to determine P value. g, Proportion of partial (DJH) and complete (VHDJH) Igh rearrangements in young and old pro-B cells from C57BL/6J mice (n = 2) are shown. h, Proportion of productive (those that can encode IgH protein) and non-productive VHDJH junctions in young and old pro-B cells from C57BL/6J mice (n = 2). Bar graph represents the mean of two replicate experiments, with each replicate shown as a dot for e, g and h.

