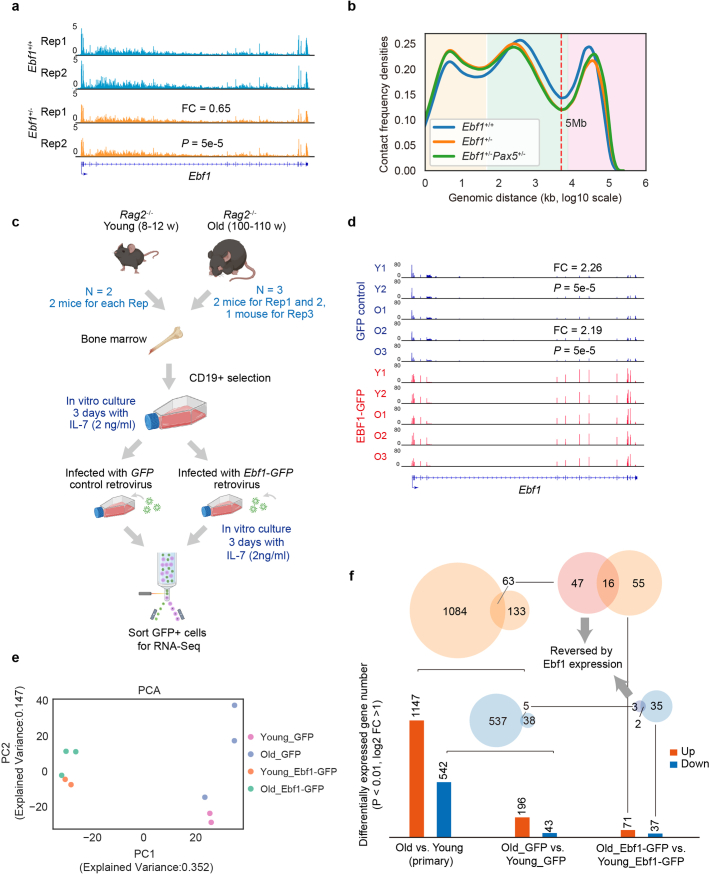
Extended Data Fig. 2. Ebf1 perturbation causes chromatin structure and expression changes in pro-B cells.
(a) Normalized tracks for RNA-Seq of Ebf1+/+ and Ebf1+/− pro-B cells across the Ebf1 locus are shown with IGV. “FC” represents fold change, and the Poisson test was applied with P values indicated (n = 2). (b) Average Hi-C contact plots (n = 2) derived from Ebf1+/+ and Ebf1+/− pro-B cells. Color shading refers to: compartments: pink, TADs and loops: green, and close interactions: yellow. (c) Experimental scheme for overexpressing Ebf1 in cultured pro-B cells. (d) Normalized tracks for RNA-Seq across the Ebf1 locus of different samples are shown with IGV. “FC” represents fold change, and the Poisson test was applied with P values indicated (n = 2). (e) Principal component analysis (PCA) plot depicting the distribution of RNA-Seq from different samples as indicated. (f) Schematic representation of differentially expressed gene counts across multiple comparisons.

