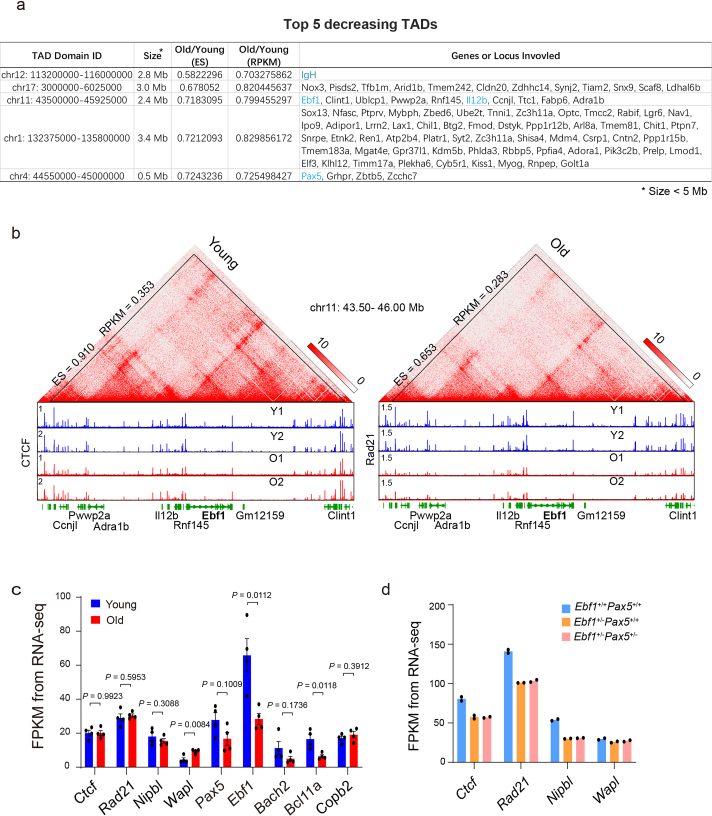
Extended Data Fig. 3. Most decreased TADs in aged pro-B cells.
(a) A chart showing information of top 5 decreased TADs. TAD size is limited to be less than 5 Mb. B cell associated genes are in blue. (b) An example showing one of the top decreased TAD containing Ebf1 locus. Young (left) and old (right) Hi-C contact frequency heat maps are in 5 kb resolution. Normalized tracks for CTCF (left) and Rad21 (right) ChIP-Seq across the TAD are shown with IGV. ES (enrichment score) and RPKM values of the TAD are annotated. (c) Normalized expression levels of key genes involved in either chromatin structure maintenance (Ctcf, Rad21, Nipbl and Wapl) or B cell development (Pax5, Ebf1, Bach2 and Bcl11a) in young and old pro-B cells (n = 4). Copb2 is shown as a control. Data are presented as mean ± SEM. Unpaired two-sided t test was used and P-values were indicated. (d) Normalized expression levels of key genes involved in chromatin structure maintaining in Ebf1+/+, Ebf1+/− and Ebf1+/−Pax5+/− pro-B cells (n = 2). Bar graph represents the mean of two replicate experiments, with each replicate shown as a dot.

