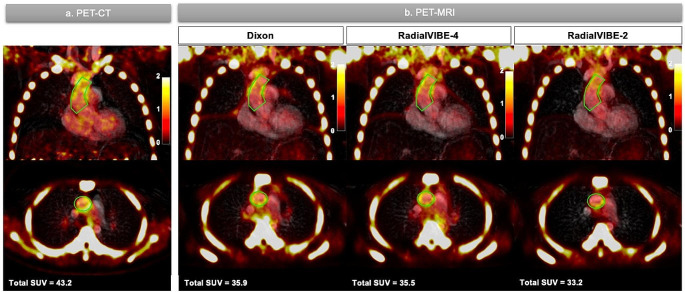
Fig. 3.
Representative coronal and axial images of ascending aortic sodium [18F]fluoride quantification in positron emission tomography (PET) images of a patient with bicuspid aortic valve. (a) PET-computed tomography (CT) co-registered with magnetic resonance angiography (MRA). (b) PET-magnetic resonance imaging (MRI) combined with MRA in each attenuation correction method (Dixon, RadialVIBE-4 and RadialVIBE-2). Green line represents region of interest around the ascending aorta. Colour scale on the right of images represents standardised uptake values. Total SUV = total standardised uptake value

