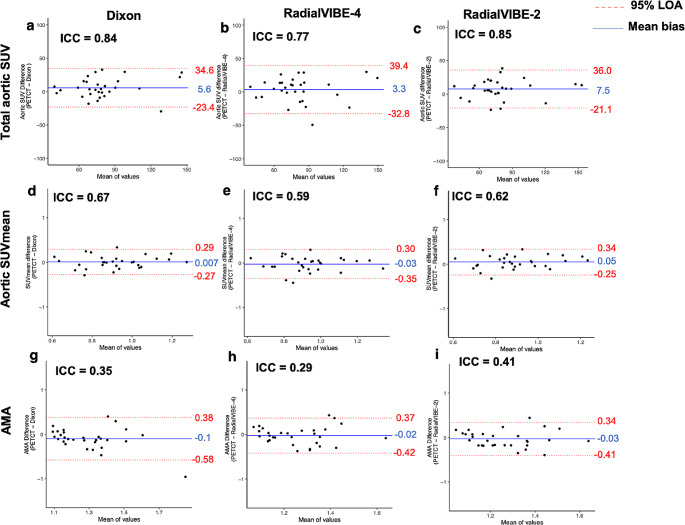
Fig. 4.
Levels of agreement are assessed in the three different methods of measuring aortic sodium [18F]fluoride uptake. Bland-Altman plots demonstrate percentage difference in values with mean bias (blue line) and 95% limits of agreement (red lines) for aortic sodium [18F]fluoride activity. The columns represent the PET (positron emission tomography) and magnetic resonance imaging (MRI) attenuation correction method compared with PET and computed tomography (CT) method. (a-c) represent total aortic standardised uptake value (SUV), (d-f) represent aortic mean standardised uptake (SUVmean), and (g-i) represent aortic microcalcification activity (AMA). ICC = intraclass correlation coefficient, LOA = limits of agreement

