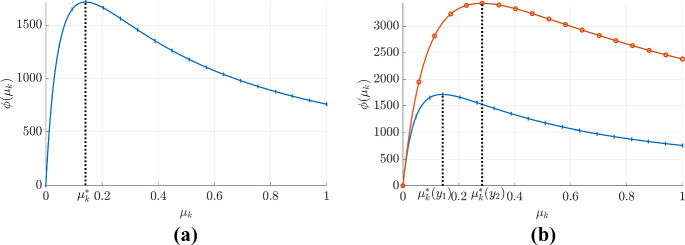
Fig. 2.
Fitness function and evolutionary stable strategy for a virus population. Panel a presents the fitness function () as a function of virulence for a given strain, assuming no direct dependence from others. It should be noted that this function exhibits a global maximum, achieved at , indicating as the ESS for the pathogen. Panel b illustrates how the fitness function changes with the parameter . The red (with open circles) and blue curves (with vertical marks) represent the fitness function when the parameter takes values and , respectively. Notably, the global maximum of each of these curves is achieved at (for the red curve, open circles) and (for the blue curve, vertical marks), indicating the ESS for the respective parameter values. This observation illustrates the change in ESS with a given parameter (Color figure online)

