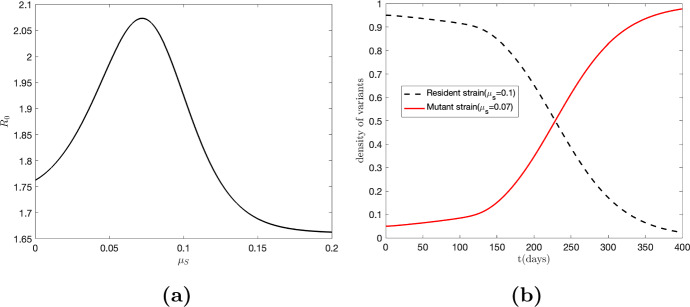
Fig. 5.
Panel a illustrates the basic reproduction number () as a function of virulence (), considering a transmission rate given by . The plot reveals a global maximum of occurring around . In panel b, the red curve represents the infected population with the mutant strain (), exhibiting an increasing trend, while the black curve depicts the infected population with the resident strain (), showing a decreasing trend. This observation suggests that the mutant variant is invading the population, indicating that the resident strain is not in its ESS (Color figure online)

