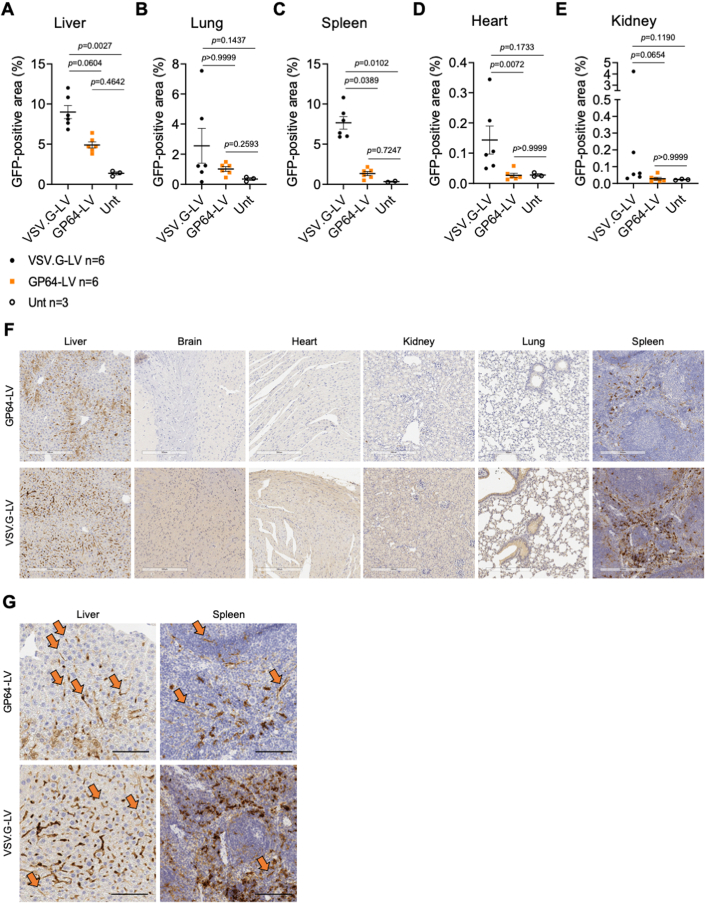
Figure EV3. Biodistribution analysis of GP64-LV after systemic administration in mice.
(A–E) Single values, mean and SEM of GFP-positive tissue measured by immunohistochemistry in the liver (A), lung (B), spleen (C), heart (D) or kidney (E) of 8-week-old mice analyzed 10 days after i.v. administration of VSV.G-LV or GP64-LV at 4e10 TU/kg (n = 6 mice per group), or left untreated for background signal evaluation (n = 3). Kruskal–Wallis test with Dunn’s multiple comparison test. (F) Representative anti-GFP immunohistochemistry images of liver, brain, heart, kidney, lungs, spleen of mice treated with GP64-LV or VSV.G-LV, as indicated, analyzed in (A–E). Scale bar: 300 µm. (G) Higher magnification of liver and spleen sections shown in (F). Orange arrows indicate GFP-positive endothelial cells, identified by morphology. Scale bar: 100 µm.

