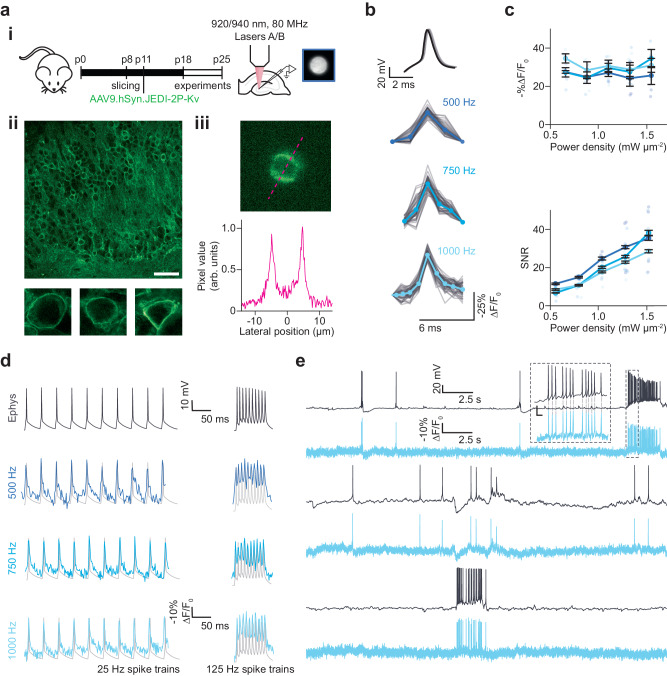
Fig. 3. Scanless two-photon voltage imaging of neural activity in hippocampal organotypic slices.
a (i) Schematic representation of the protocol used to prepare JEDI-2P-Kv expressing hippocampal organotypic slices (see “Methods” section and Supplementary Table 1). (ii) Upper: confocal image of a representative organotypic slice bulk-infected with JEDI-2P-Kv. Scale bar represents 50 µm. Lower: confocal images of single representative JEDI-2P-Kv expressing neurons in the dentate gyrus (n = 29 slices from 16 independent slice cultures). (iii) Upper: representative image acquired with 2P-TF-GPC (1 kHz acquisition rate, average temporal projection), Lower: line-profile through the image (indicated by the magenta dashed line). b Electrically induced and recorded APs (upper, black) and optically recorded (lower) were resolved in single trials (plotted in grey) using 2P voltage imaging at different acquisition rates. The average traces from different acquisition rates (500 Hz, 750 Hz and 1 kHz, power density: 1.1 mW µm−2) are plotted in different shades of blue. c −%∆F/F0 and SNR plotted as a function of power density in different shades of blue for different acquisition rates. Error bars represent the standard error of measurements across all cells (n = 4−6 neurons, refer to Table 1 in “Methods” section for precise values of n). Individual points represent the average value over 50 evoked APs for each individual cell. d Representative fluorescence responses recorded from an individual cell whilst 25 and 125 Hz spike trains were evoked and recorded electrically (labelled). Imaging data was acquired at three different rates (500 Hz, 750 Hz and 1 kHz, power density: 1.11 mW µm−2). Data from different acquisition rates is plotted in different shades of blue, and corresponding electrophysiological whole-cell patch-clamp recordings are plotted in grey (n = 2–5 neurons from 3 different slices, from 1 slice culture). e Simultaneous current-clamp (upper, black) and fluorescence recordings (lower, blue) of spontaneous activity in neurons in the dentate gyrus of hippocampal organotypic slices over a continuous 30 s recording period. Inset: zoomed in portion of the electrophysiological and fluorescence traces. The dashed light grey lines indicate the correspondence between APs in the electrophysiological and fluorescence traces (average spike train rate: 17 Hz, power density: 1.33 mW µm−2, 1 kHz acquisition rate). Source data are provided as a Source Data file.

