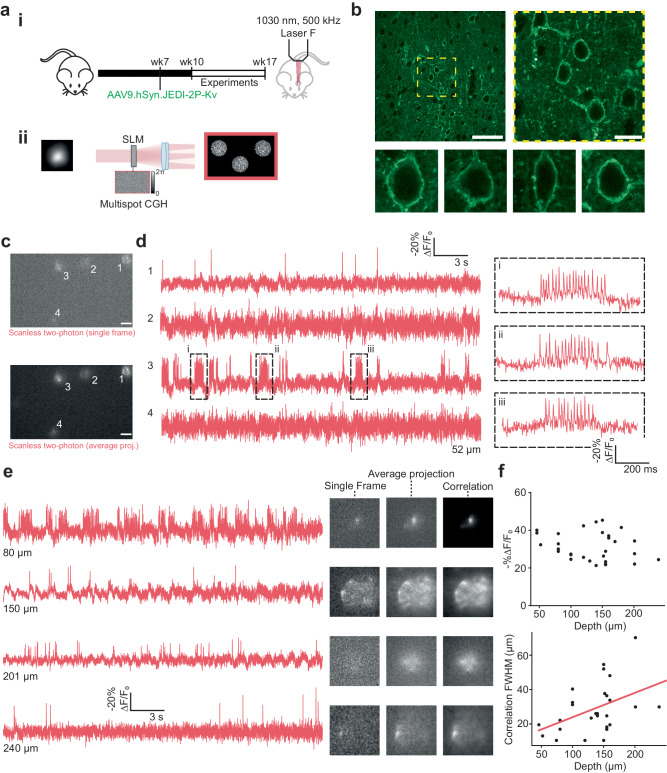
Fig. 6. Scanless two-photon voltage imaging in vivo.
a (i) Schematic representation of the protocol used to prepare mice expressing JEDI-2P-Kv for in vivo scanless 2P voltage imaging (see “Methods” section). (ii) Several neurons were illuminated simultaneously by generating multiple holographic spots using holography (CGH) (“Methods” section, Supplementary Table 1). All experiments were performed using 17 µm TF-CGH spots at 1030 nm (laser F, 500 kHz repetition rate, power densities: 0.02–0.07 mW µm−2). Data was acquired for 30 s at an acquisition rate of 500 Hz with camera A. b Upper: representative images of JEDI-2P-Kv expression in L2/3 of the barrel cortex at different scales (n = 4 mice). Yellow dashed box indicates the zoomed in region, shown on the right panel. Scale bars from left to right represent 50 µm and 15 µm respectively. Lower: confocal images of single representative JEDI-2P-Kv expressing neurons in L2/3 of the barrel cortex, taken from multiple mice (n = 4 mice). c Single frame and average (temporal) projection of data acquired during a representative in vivo multi-target scanless 2P voltage imaging experiment (power density: 0.02 mW µm−2, depth: 52 µm below the dura). Scale bar represents 20 µm. d Fluorescence traces from the cells identified in b, as numbered. Responses are reported as the fluorescence change (∆F), expressed as a percentage of the baseline fluorescence F0 (−%∆F/F0). Inset: zoomed in portion of the bursts of APs which have an average firing rate of 50 Hz. e Left: fluorescence traces from cells acquired from different experiments at different depths below the dura (80–240 µm, as indicated). Right: single frames, temporal projections and correlation images (see “Methods” section) are also provided for reference. f Characterisation of the -%∆F/F0 and correlation FWHM (see “Methods” section), plotted as a function of target depth below the cortical surface. Individual points (black) represent the average value for a single (responsive) target during a single experiment (n = 43 fields of view (30 independent) from 7 mice). A linear, least-squares, fit to the experimental data is displayed in red. Source data are provided as a Source Data file.

