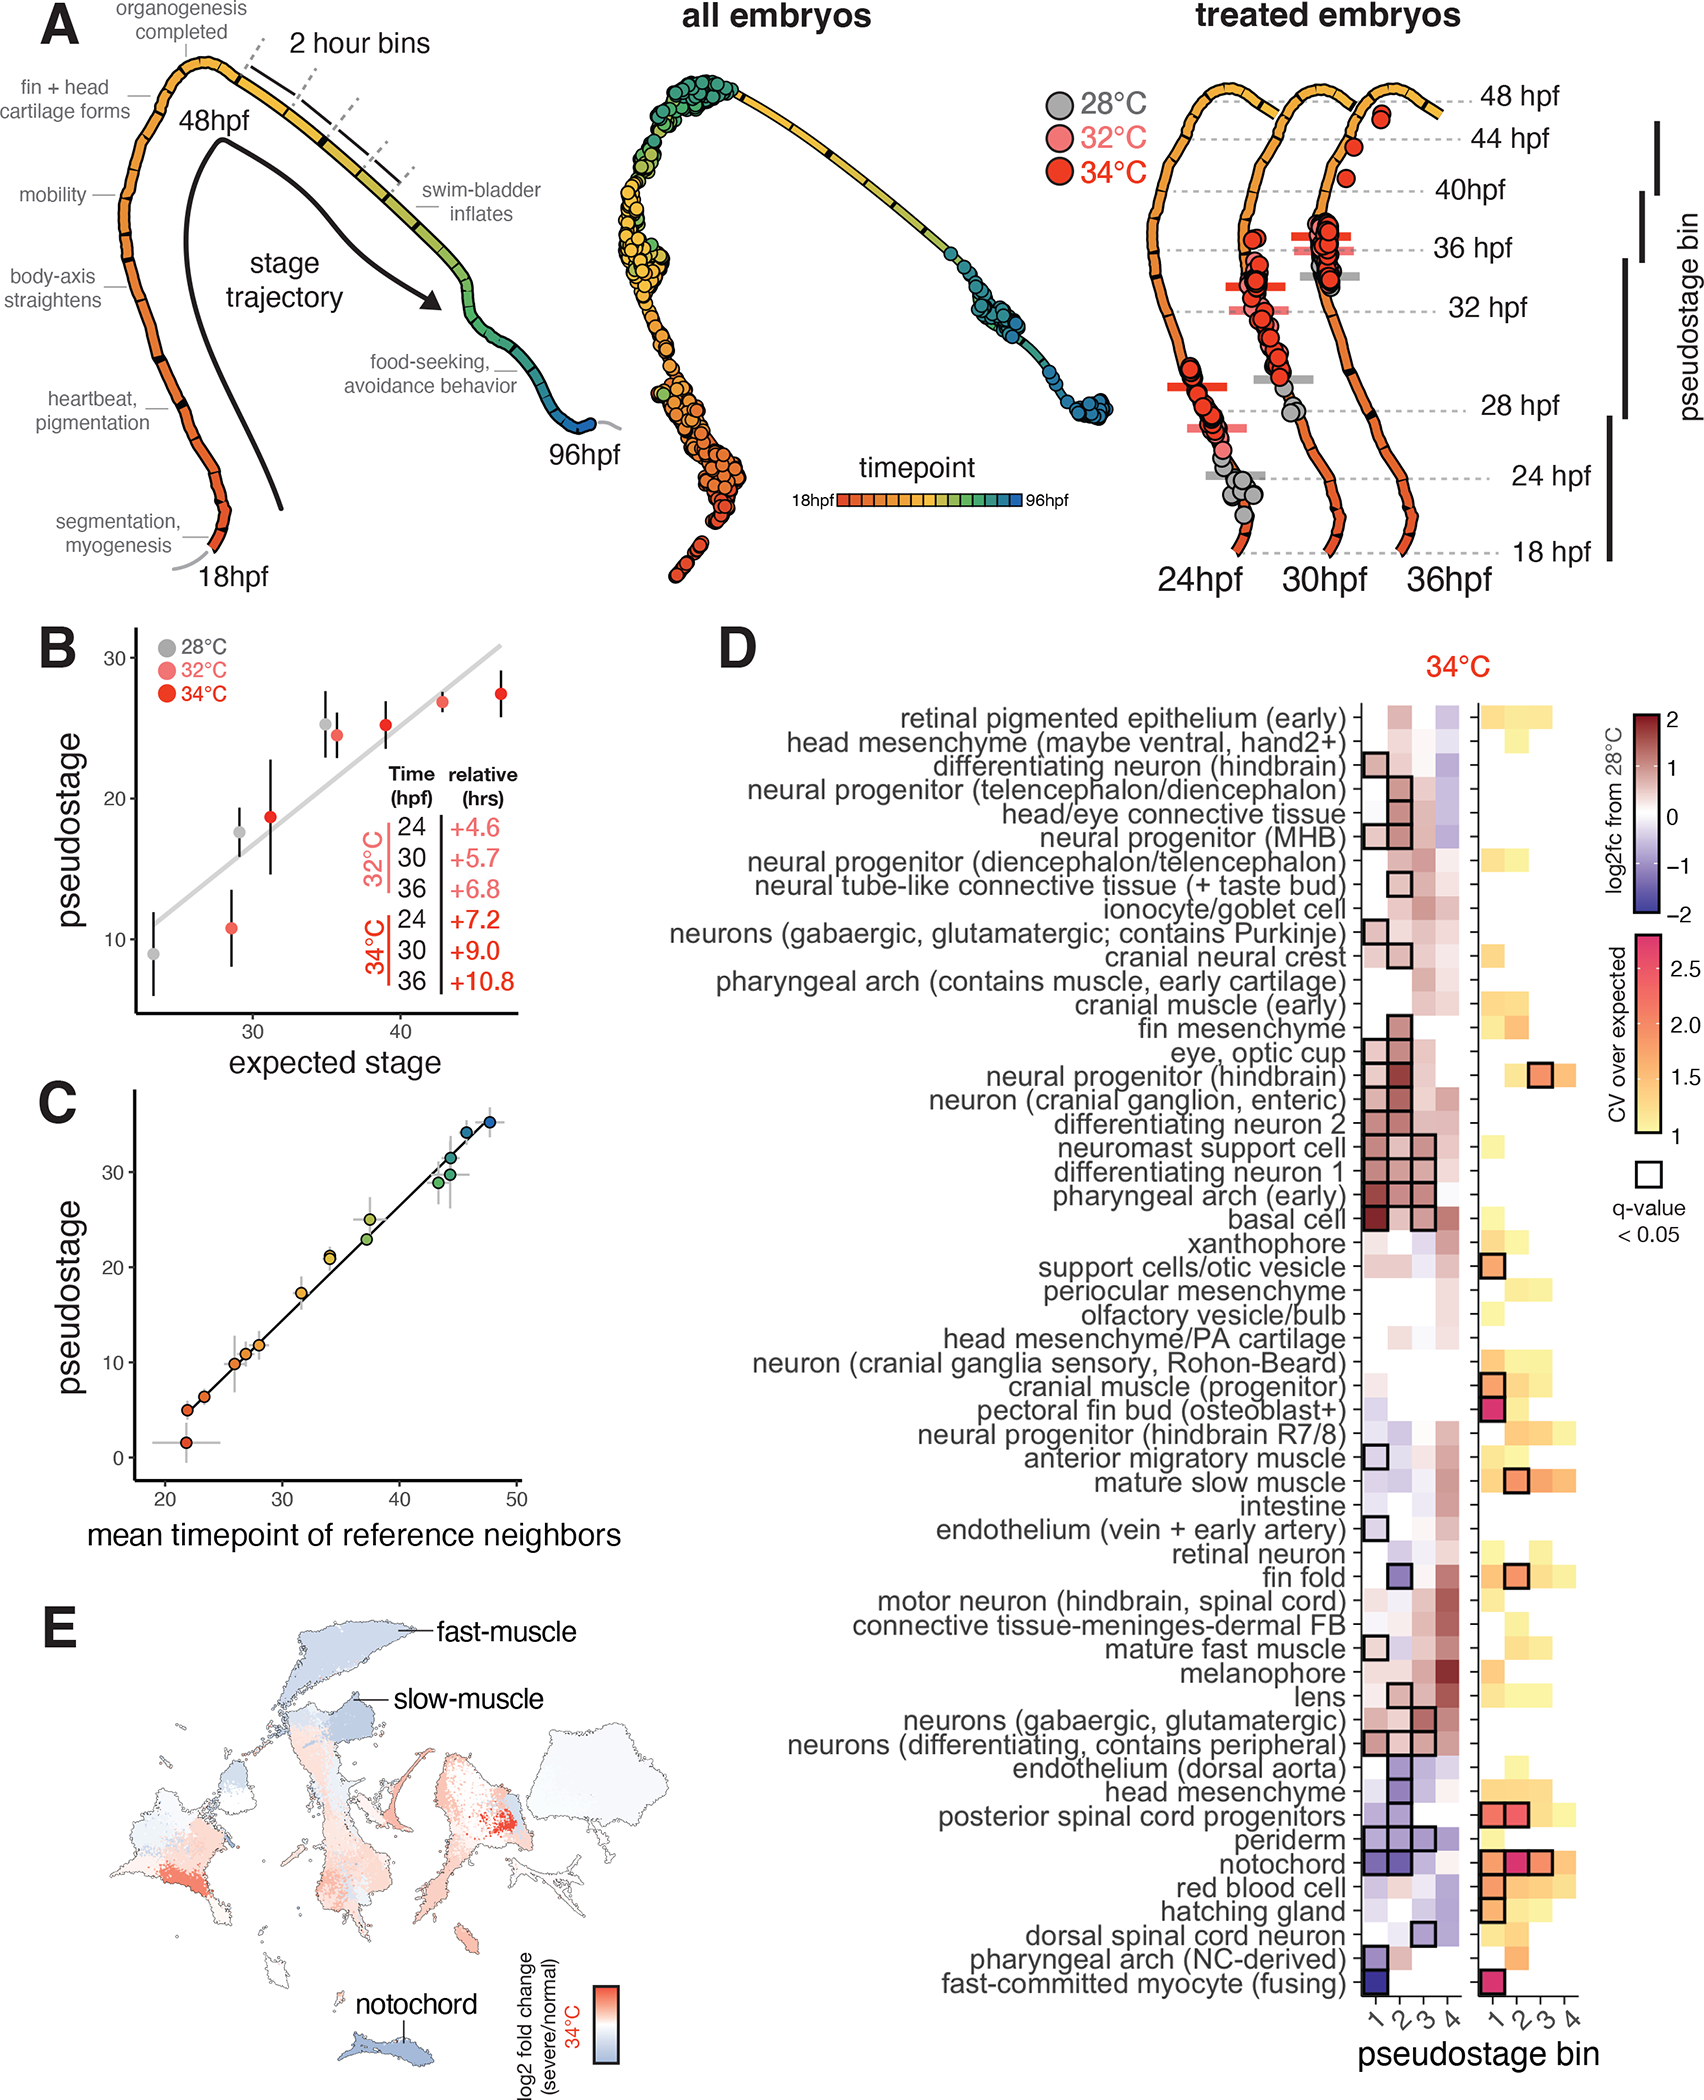
Figure 2. Staging embryos by cell type composition captures temperature-induced acceleration of development and allows isolation of temperature-dependent effects on cell abundance.

(A), UMAP projection of embryo trajectory produced using all individual embryos from the developmental reference; each segment of the principal graph represents a 2-hour window of development, with key events noted. Right panel shows how, at each time point, embryos from elevated temperature are “ahead” of their 28°C counterparts on the embryo stage trajectory (median pseduostage for each temperature indicated with horizontal bars). (B), Scatterplot showing mean pseudostage values are correlated with expectations from a linear model of temperature-induced acceleration of developmental rate; error bars represent standard deviation. Result of linear regression is shown in black. (C), Scatterplot showing mean pseudostage values for all embryos in the reference dataset compared to a nearest-neighbor label transfer in transcriptome space; error bars on both axes represent standard deviation; both cell composition and transcriptomes contain ample information on developmental stage. (D), Heatmap showing the effects of temperature on mean cell type abundance relative to untreated, stage-matched controls (left) and on variability (CV relative to controls) of cell counts (right). Significant tests (q < 0.05) from beta binomial regression are indicated with a black box. Each column represents a pseudostage bin, wherein embryos from untreated and treated samples are stage-matched. (E), UMAP projection of all cell types, colored by relative abundance change in severe (bent) individuals raised at 34°C compared to normal-looking embryos also raised at 34°C.
