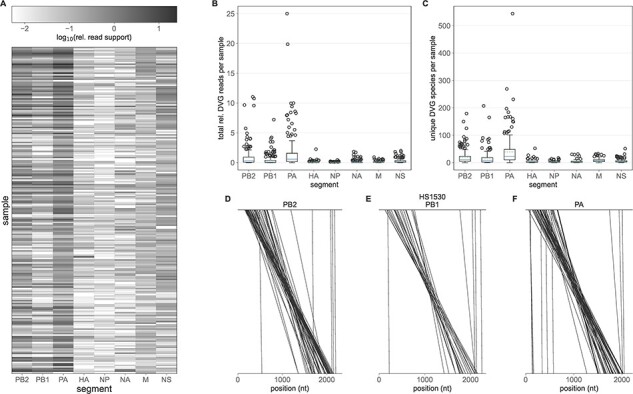
Figure 1.

DVGs identified in clinical samples. (A) Heatmap showing the prevalence of DVGs in each sample (rows), by gene segment (columns). DVG prevalence is quantified by the total relative DVG read support across a given segment. (B) Total relative DVG reads per sample per segment. (C) Number of unique DVG species per sample per segment. In (B) and (C), solid lines in the boxplots show the median value for each segment, dotted lines show the mean, and box extends to the limits of the IQR, and whiskers extend to 1.5 IQR below and above the first and third quartiles, respectively. Outliers are shown as dots beyond the range of the whiskers. (D–F) Breakpoints of all PB2 (D), PB1 (E), and PA (F) DVG species identified in representative sample HS1530. Each line connects the last undeleted base on the 5ʹ end of the DVG and the first undeleted base on the 3ʹ end of the DVG.
