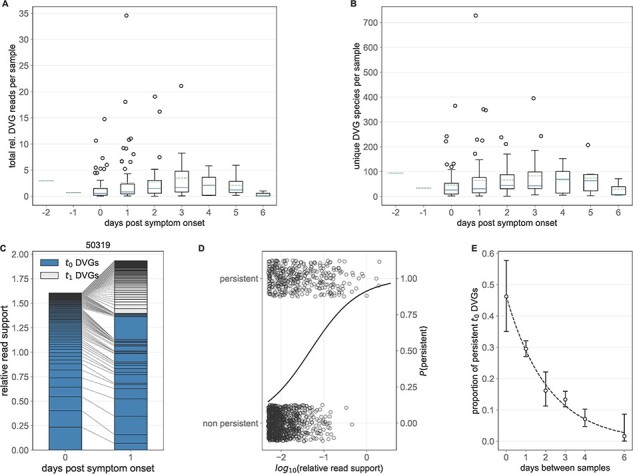
Figure 2.

Polymerase DVG dynamics over the course of infection. (A) Total relative polymerase DVG reads per sample as a function of the number of days post symptom onset that a given sample was taken. (B) Number of unique polymerase DVGs per sample as a function of the number of days post symptom onset that a given sample was taken. In (A) and (B), solid lines in the boxplots show the median value for each segment, dotted lines show the mean, box extends to the limits of the IQR, and whiskers extend to 1.5 IQR below and above the first and third quartiles, respectively. Outliers are shown as dots beyond the range of the whiskers. (C) Longitudinal DVG dynamics in Representative Individual 50319. Lines connect the relative read support of a given polymerase DVG in each of the two samples taken. DVGs first observed at the first time point (t0 DVGs) are shaded and those observed at the second, but not the first, time point (t1 DVGs) are unshaded. (D) log10 relative read support of t0 DVGs which do and do not persist at time t1 for longitudinal samples from the same subject 1 day apart. Solid line represents the estimated probability of a DVG with a given log10 relative read support persisting from a logistic regression. (E) Proportion of all DVGs observed in a given t0 sample that are also observed in the corresponding t1 sample as a function of the number of days between when those samples were taken. Whiskers extend to the exact binomial confidence intervals for a given proportion.
