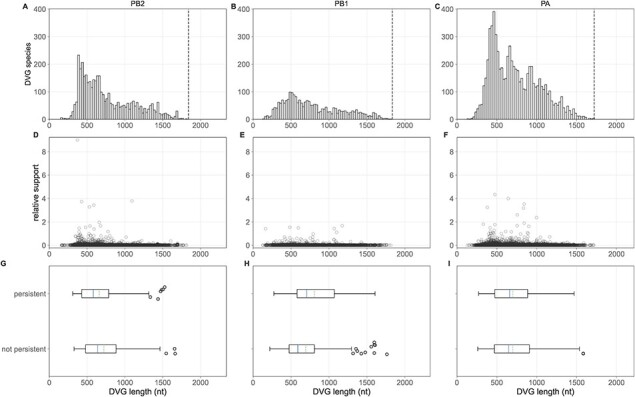
Figure 3.

Length patterns of observed polymerase DVGs. Top row: Length of all observed DVG species in the PB2 (A), PB1, (B), and PA (C) segments, binned in 25 nucleotide bins. Vertical dotted line shows our threshold for calling a ‘defective’ genome. Middle row: Relative read support of DVG species in the PB2 (A), PB1 (B), and PA (C) segments plotted as a function of their length. Bottom row: PB2 (G), PB1 (H), and PA (I) DVGs observed at the first time point in the 24 individuals with available sequence data on consecutive days (N = 24) stratified by whether they are observed at the second time point (‘persistent’) or not (‘not persistent’) plotted as a function of their length. Solid lines in the boxplots show the median value for each segment, dotted lines show the mean, and box extends to the limits of the IQR, and whiskers extend to 1.5 IQR below and above the first and third quartiles, respectively.
