
Figure 4.
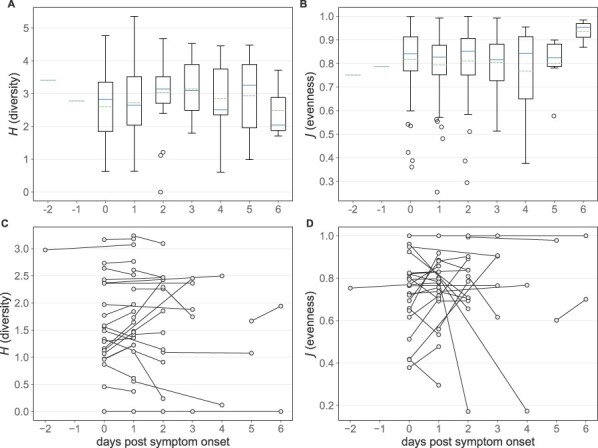
Longitudinal trends in polymerase DVG diversity and evenness. (A) Diversity of DVG populations among all samples stratified by time since symtpom onset. (B) Evenness of DVG populations among all samples stratified by time since symptom onset, excluding samples in which only one DVG was identified. In (A) and (B), solid lines in the boxplots show the median value for each segment, dotted lines show the mean, and box extends to the limits of the IQR, and whiskers extend to 1.5 IQR below and above the first and third quartiles, respectively. Outliers are shown as dots beyond the range of the whiskers. (C) Diversity at both sampling times of the subset of DVGs present in the first sample among individuals with longitudinal sampling. (D) Evenness at both sampling times of the subset of DVGs present in the first sample among individuals with longitudinal sampling, excluding individuals with only one DVG at the first sampling time.