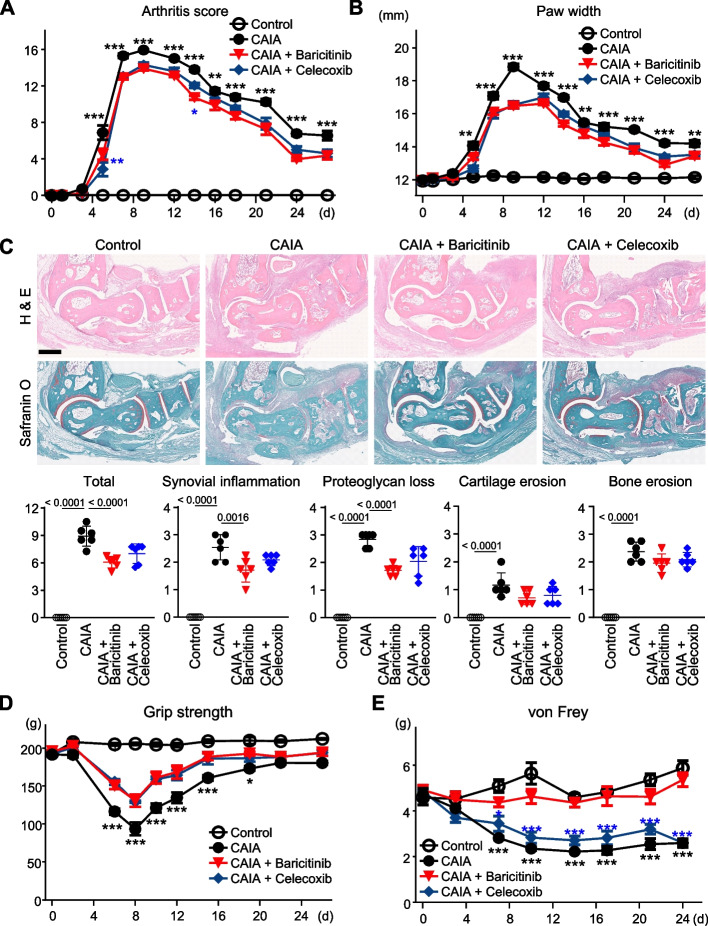
Fig. 1.
Arthritis transition of CAIA model mice. The transition of arthritis score (A) and paw width (B) of mice without CAIA induction (Control), CAIA-induced mice without treatment (CAIA), CAIA-induced mice treated with baricitinib (CAIA + Baricitinib) or celecoxib (CAIA + Celecoxib), during a four-week period following CAIA induction. (C) H&E and safranin O staining of ankle joints of the four groups at day 8. Scale bar, 5 mm. Lower panels indicate quantified scores for histological findings. (D) The transition of grip strength of the four groups over the four weeks. (E) The transition of withdrawal threshold of the four groups over the four weeks, based on von Frey test results. The data are expressed as line graphs and means ± SEM (A, B, D, E) or as dot plots and means ± SD (C) (n = 6 mice/group for A, B, D and E, and n = 6 sections with 3 mice/group for C). *P < 0.05, **P < 0.01, ***P < 0.005; two-way ANOVA (A, B, D, E), or P-values determined by one-way ANOVA (C) followed by Tukey’s post hoc test. Black and blue asterisks indicate the P-values of CAIA + Baricitinib vs CAIA, or CAIA + Baricitinib vs CAIA + Celecoxib, respectively

