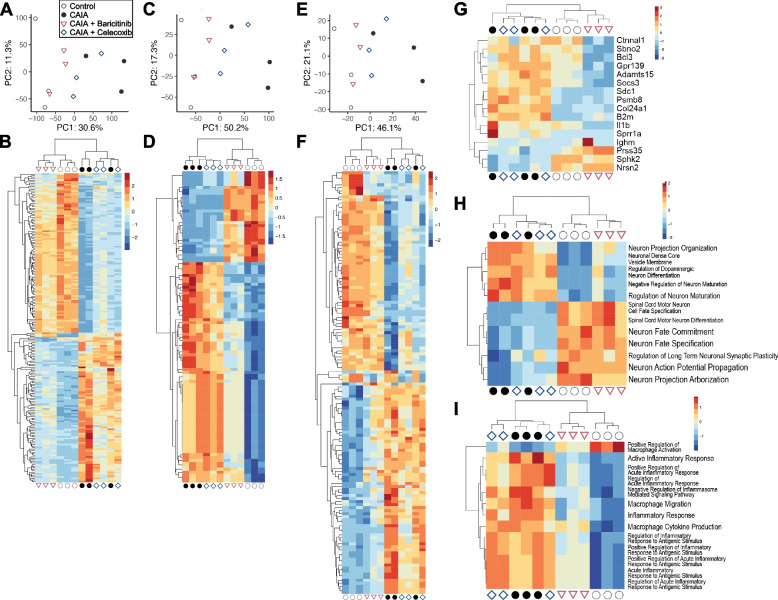
Fig. 3.
Comprehensive RNA-seq analyses of gene expression in the DRG. PCA (A, C, E) and heatmaps (B, D, F) of DEGs in DRG samples of the four groups at day 8 (n = 3 mice/group). The analyses were based on genes (A and B), GO terms (C and D) and pathways (E and F). All significantly changed genes (B), GO terms (D) and pathways (F) are shown in the heatmaps. Heatmaps with the names of genes, GO terms and pathways can be found in Supplementary Fig. 1–3. (G) A heatmap of genes that were significantly altered in the CAIA + Baricitinib group. (H) Heatmaps of neuron-related GO terms that were significantly altered in the CAIA + Baricitinib group. (I) Heatmaps of macrophage inflammation-related GO terms that were significantly altered in the CAIA + Baricitinib group. The colours of the heatmaps represent the expression levels of each gene or gene set. High levels of expression are depicted in red, while low levels of expression are depicted in blue

