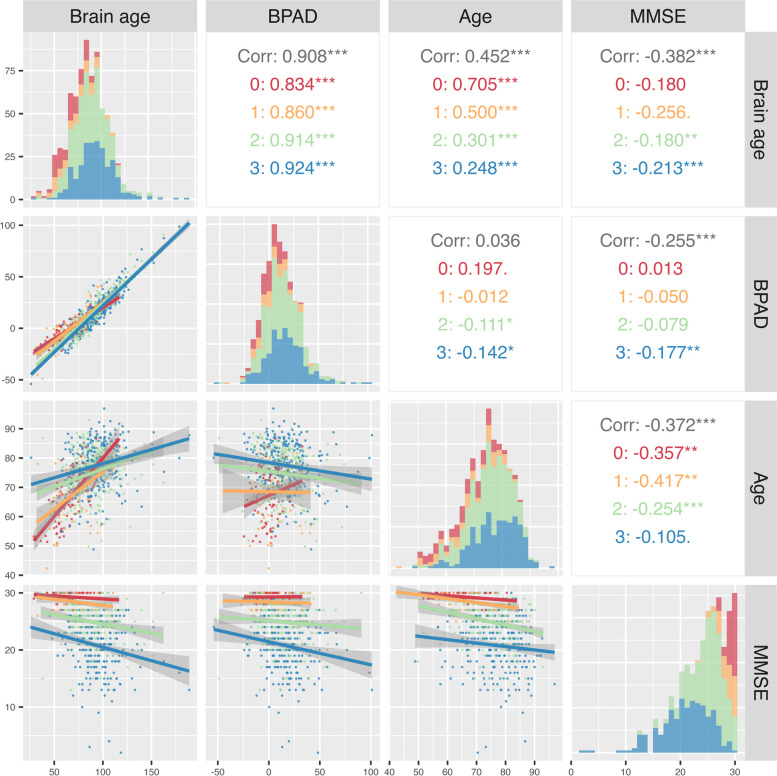
Fig. 3.
Correlation matrix. Correlogram of the following selected variables: Brain-predicted age difference (BPAD), brain age, Mini-Mental State Examination (MMSE) score and chronological age (Age). Figures are color-coded based on diagnostic index; healthy controls, HC (red), subjective cognitive decline, SCD (yellow), mild cognitive impairment, MCI (green), Alzheimer’s disease dementia, ADD (blue). Below diagonal: visualization of correlation graphs per variable combination. Diagonal: depiction of variable distribution. Above diagonal: correlation coefficients for (from top to bottom): total dataset (Corr), HC, SCD subjects, MCI patients, and ADD patients. *p < 0.05, **p < 0.01, ***p < 0.001

