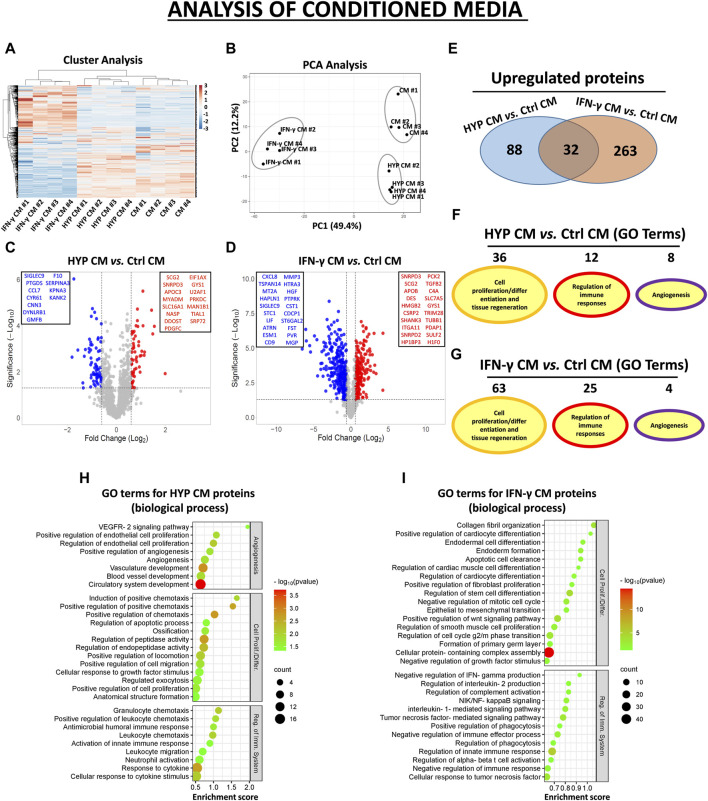
FIGURE 2.
Protein secretion profiles in conditioned medium (CM) derived from unprimed hAMSCs (ctrl) and primed hAMSCs under hypoxia (HYP) or IFN-γ. (A) Secretion clusters (z-scores) of both up- and downregulated proteins in CM derived from hAMSCs (CM), hypoxic hAMSCs (HYP CM) and IFN-γ-treated hAMSCs (IFN-γ CM). (B) Principal component analysis (PCA). (C) Volcano plot analysis (fold change >1.5 and p < 0.05) of secreted proteins in HYP CM vs. ctrl CM and (D) IFN-γ CM vs. ctrl CM. (E) Venn diagram showing the number of upregulated proteins in HYP CM and IFN-γ CM. (F) Number of GO-enriched terms associated with upregulated HYP CM and (G) IFN-γ CM proteins grouped by category. (H) GO enrichment terms of HYP CM- and (I) IFN-γ CM-upregulated proteins; partial list of the 30 most significantly enriched terms.

