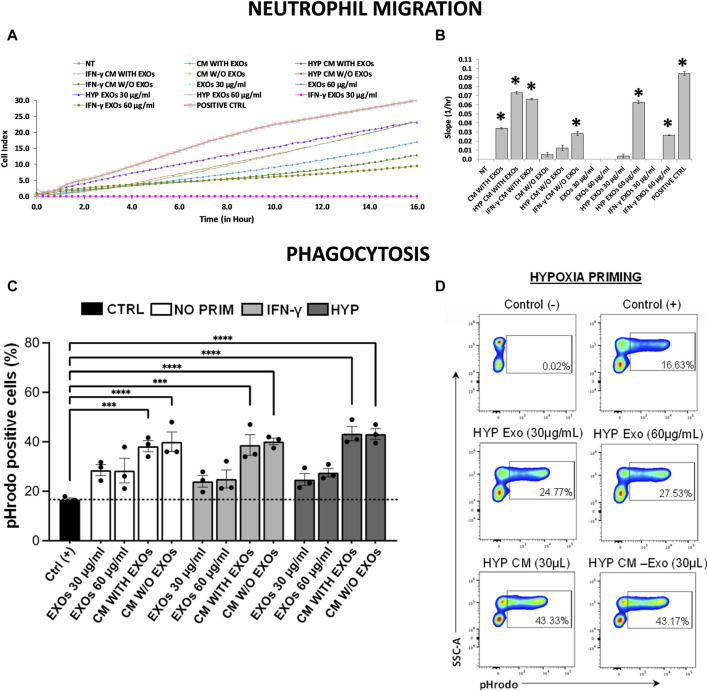
FIGURE 6.
Neutrophil migration and phagocytosis assays. (A) Real-time migration monitoring of neutrophils with the xCELLigence system. (B) Slopes of migration curves. (C, D) Analysis of phagocytosis in blood samples using pHrodo-labeled particles. (C) The histogram shows the percentages of pHrodo + cells analyzed by flow cytometry after each treatment. (D) Representative plots showing the percentages of pHrodo-labeled cells after treatment of blood samples with both CM and EXOs derived from hypoxic hAMSCs. Untreated serum-free DMEM (NT); Untreated DMEM with serum (positive ctrl); Serum-free DMEM conditioned by hAMSCs (CM with EXOs); Serum-free DMEM conditioned by hAMSCs depleted of EXOs (CM w/o EXOs); Serum-free DMEM conditioned by hypoxic hAMSCs (HYP CM with EXOs); Serum-free DMEM conditioned by hypoxic hAMSCs depleted of EXOs (HYP CM w/o EXOs); Serum-free DMEM conditioned by IFN-γ-treated hAMSCs (IFN-γ CM with EXOs); Serum-free DMEM conditioned by IFN-γ-treated hAMSCs depleted of EXOs (IFN-γ CM w/o EXOs); 30 μg/mL EXOs secreted by hAMSCs (EXOs 30 μg/mL); 60 μg/mL EXOs secreted by hAMSCs (EXOs 60 μg/mL); 30 μg/mL EXOs secreted by hypoxic hAMSCs (HYP EXOs 30 μg/mL); 60 μg/mL EXOs secreted by hypoxic hAMSCs (HYP EXOs 60 μg/mL); 30 μg/mL EXOs secreted by IFN-γ-treated hAMSCs (IFN-γ EXOs 30 μg/mL); 60 μg/mL EXOs secreted by IFN-γ-treated hAMSCs (IFN-γ EXOs 60 μg/mL). Data are presented as the means ± SD of quadruplicate in a and b and triplicate in c and (D) ∗p < 0.05 vs. NT in (B). ∗∗∗p < 0.001 and ∗∗∗∗p < 0.0001 vs. positive control in (C).

