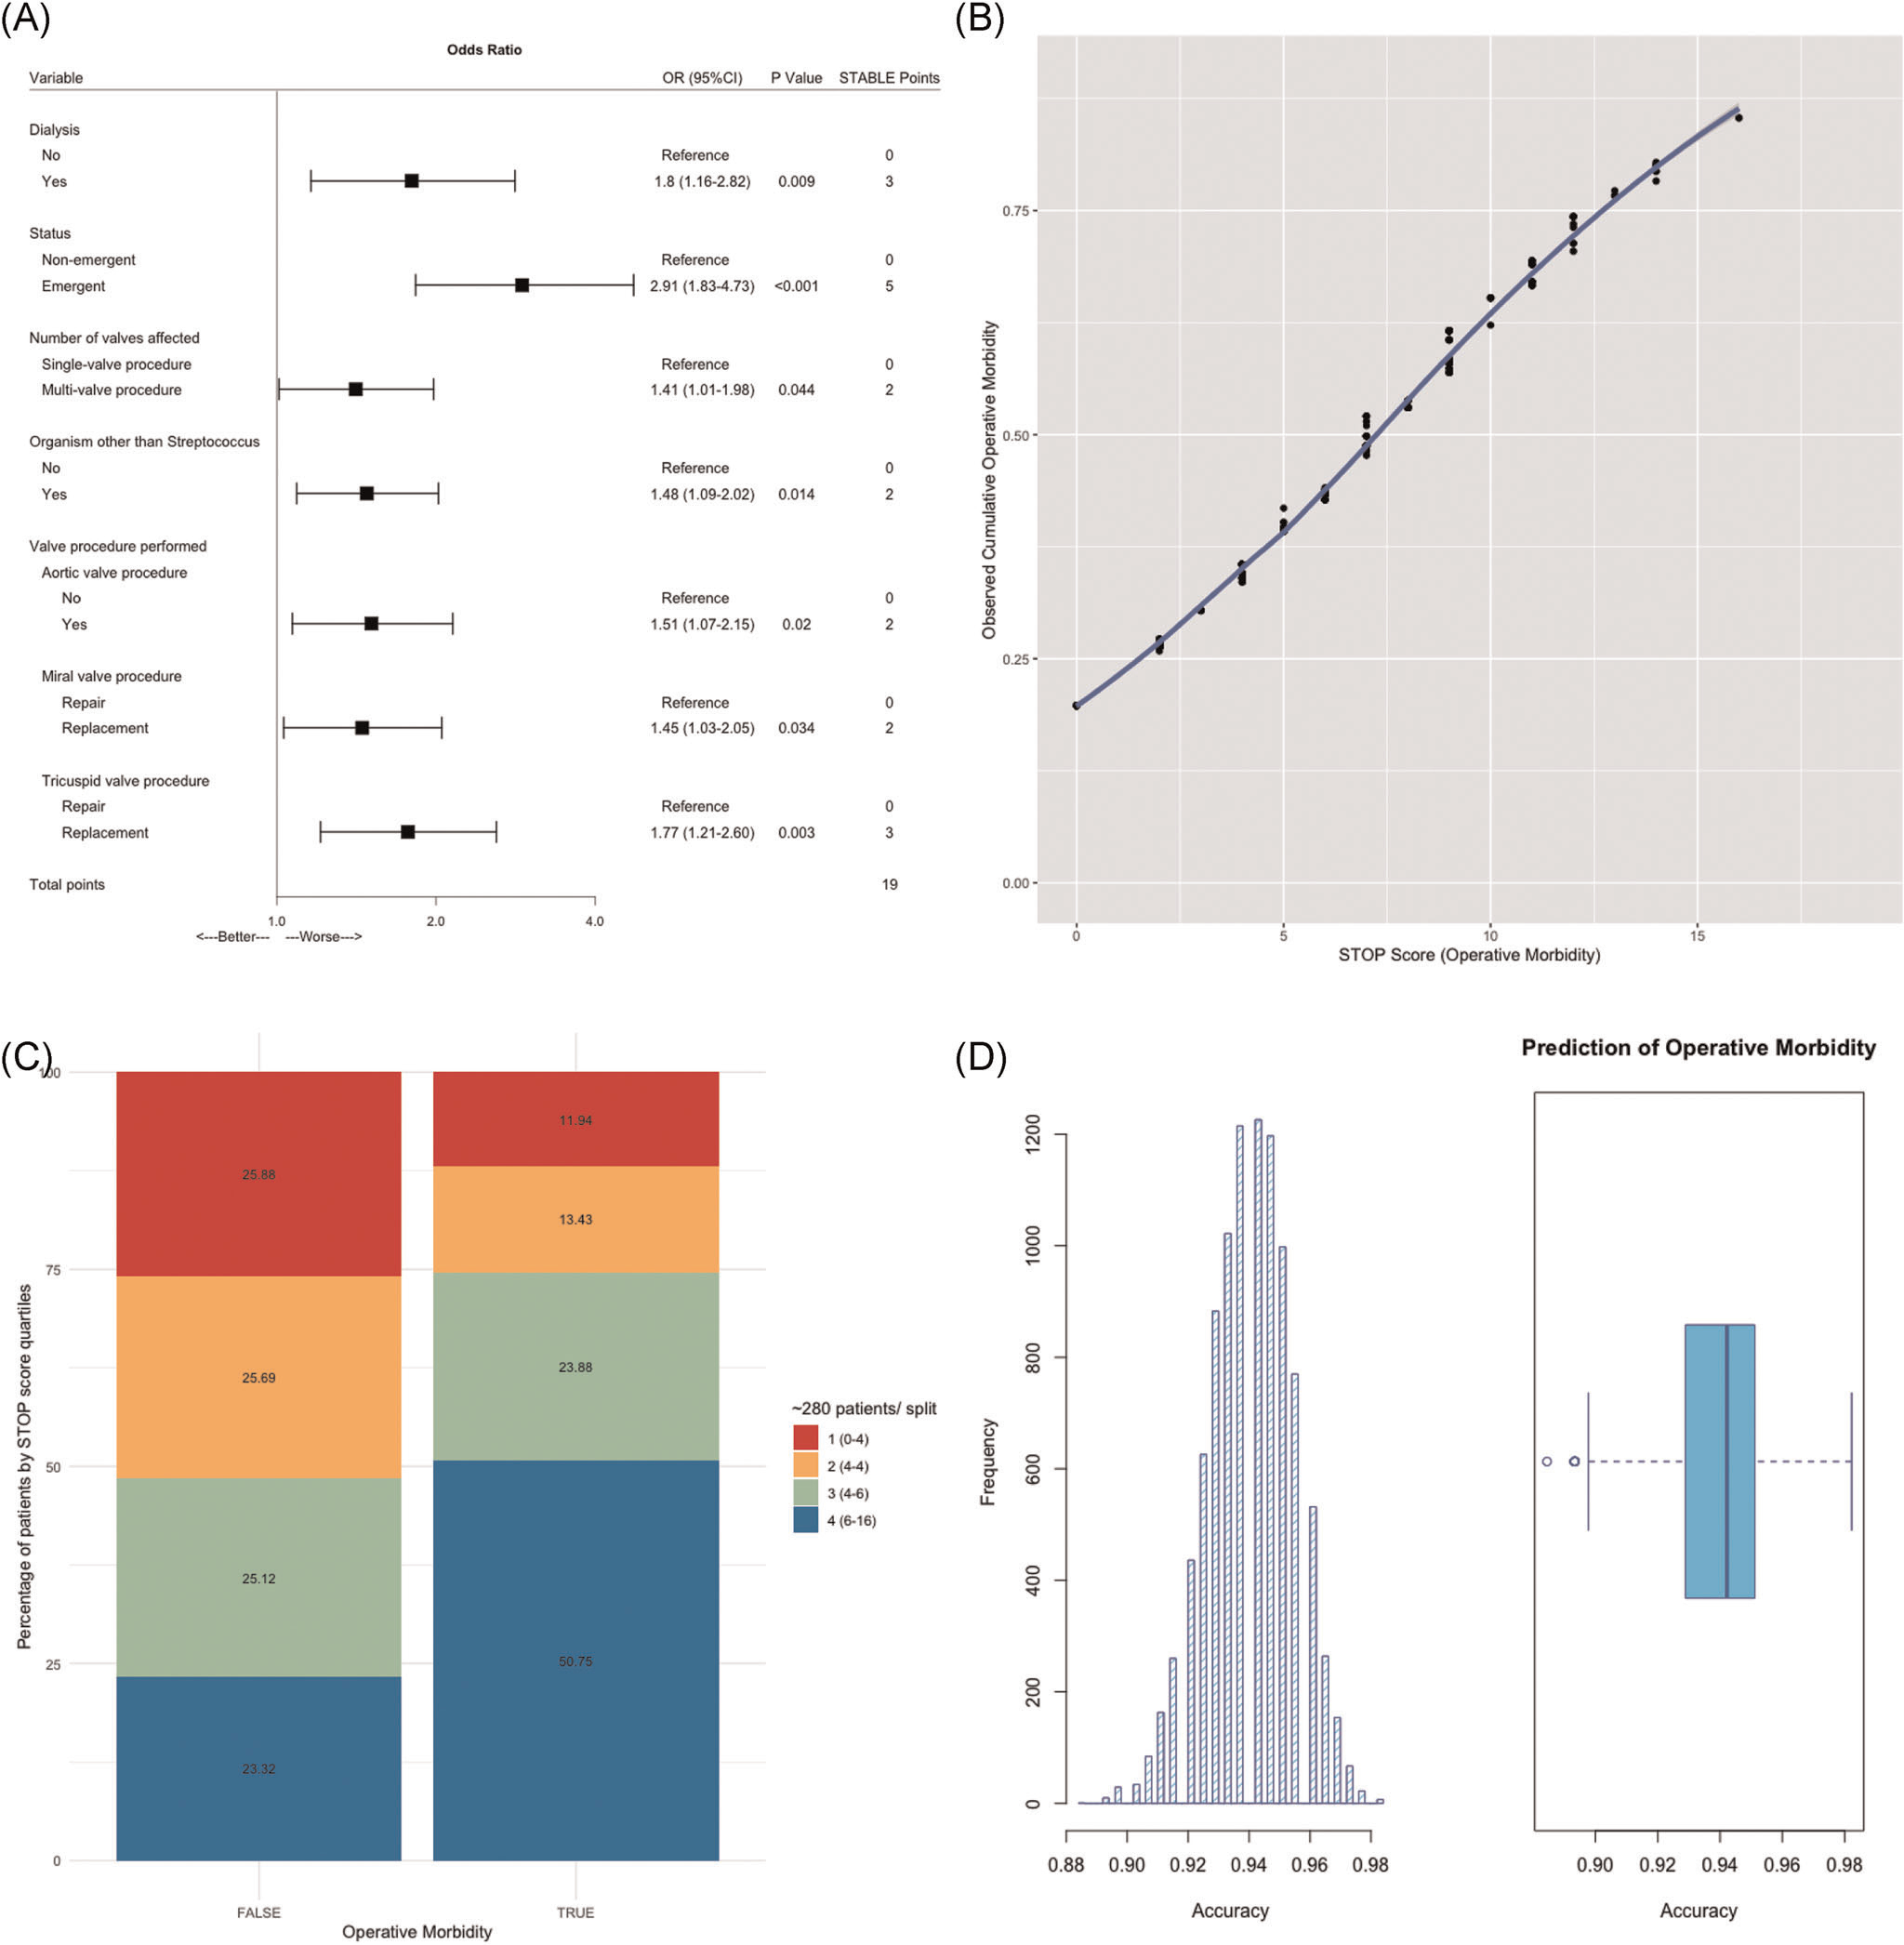
FIGURE 1.

Performance of the STOP score in predicting operative morbidity. (A) Final multivariate logistig regression. The model was selected based on AIC. STOP risk points for each selected independent variable via approximation of the magnitude of β-coefficients. (B) STOP score is presented as a function of predicted operative morbidity. Each point increased odds of operative morbidity by 22% (OR, 1.22; 95% CI, 1.16–1.28; p < .001). (C) STOP score by quartile split. The majority of patients with operative morbidity (50.8%) had STOP scores in the highest quartile (6–16 points). (D) Out-of-sample performance. K-fold cross-validation with 10,000 bootstrap replications provided an unbiased estimate of out-of-sample performance and yielded a receiver operating characteristic area under the curve (ROC AUC) of 94.0%. AIC, Akaike Information Criterion; CI, confidence interval; OR, odds ratio; STOP, STratification risk analysis in OPerative management of drug-associated IE
