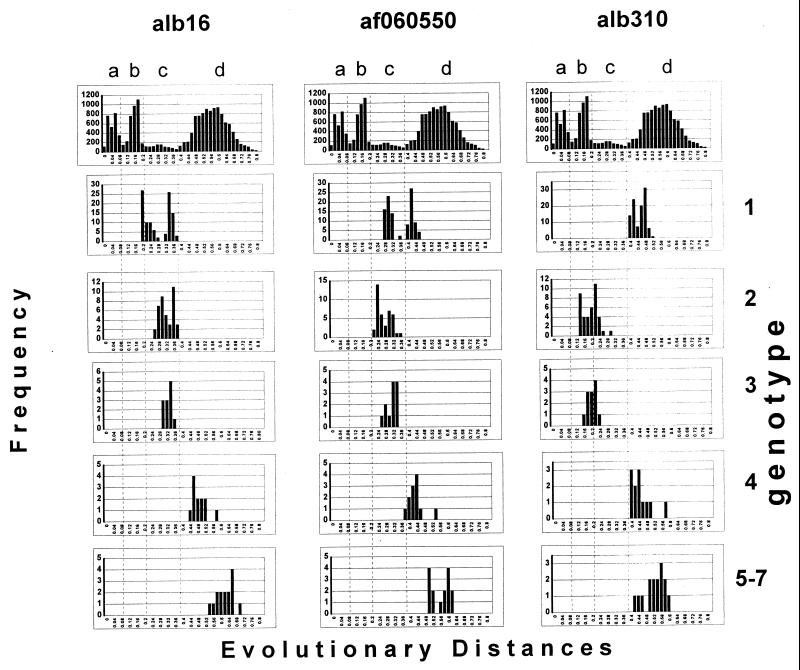
FIG. 4.
Frequency distribution of evolutionary distances between individual sequences alb16, alb310, and af060550 and sequences of genotypes 1 to 4 and a combined group composed of TTV genotypes 5 to 7. The top panel in every column is frequency distribution of evolutionary distances for all TTV sequences reproduced from Fig. 1.

