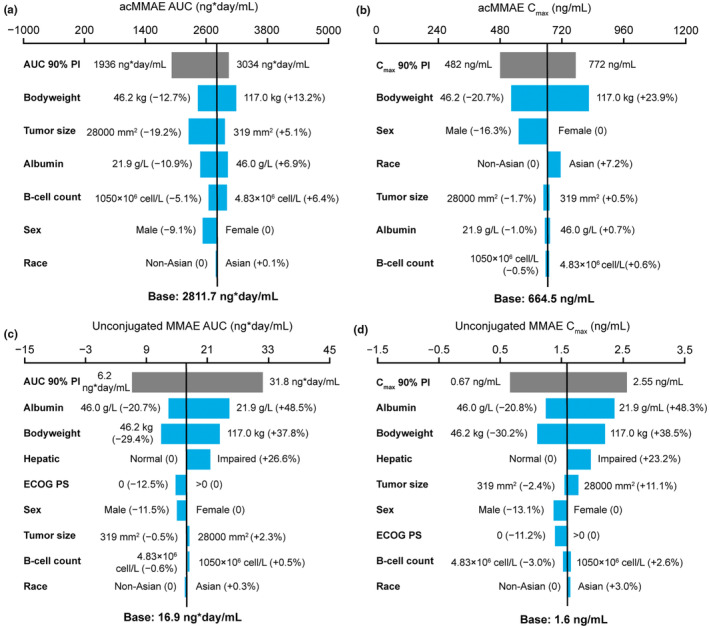
FIGURE 1.

Impact of covariates on exposure at cycle 6 following polatuzumab vedotin 1.8 mg/kg Q3W dosing. (a) acMMAE AUC. (b) acMMAE C max. (c) Unconjugated MMAE AUC. (d) Unconjugated MMAE C max. Base, as represented by the black vertical line, refers to the predicted cycle 6 exposure (C trough) of unconjugated MMAE in a typical patient. The gray bar shows the minimum and maximum exposure range across the entire population based on individual predictions. Each blue bar represents the influence of a single covariate on the cycle 6 exposure after repeated polatuzumab vedotin treatment at a dose of 1.8 mg/kg Q3W for six cycles. The label at the left end of the bar represents the covariate being evaluated. For each covariate, if continuous, two subjects were generated with extreme covariate values (2.5th and 97.5th percentile); if categorical, one subject from each category was created, with other covariates fixed at reference value (continuous) or reference category (categorical). The length of each bar describes the potential impact of that particular covariate on unconjugated MMAE exposure at cycle 6, with the percentage value in the parentheses at each end representing the percent change of exposure from the base. The most influential covariate is at the top of the plot for each exposure parameter. The typical patient is a white male patient with DLBCL receiving 1L Pola‐R‐CHP with a baseline body weight of 75 kg, baseline albumin of 35 g/L, baseline tumor size of 5000 mm2, normal hepatic function, baseline ECOG performance status score of 1, and baseline B‐cell count as 90 × 106 cell/L. 1L, first‐line; ac, antibody‐conjugated; AUC, area under the concentration–time curve; C max, maximum concentration; C trough, trough concentration; DLBCL, diffuse large B‐cell lymphoma; ECOG PS, Eastern Cooperative Oncology Group performance status; MMAE, monomethyl auristatin E; Pola‐R‐CHP, polatuzumab vedotin plus rituximab and cyclophosphamide, doxorubicin, and prednisone; Q3W, every 3 weeks.
