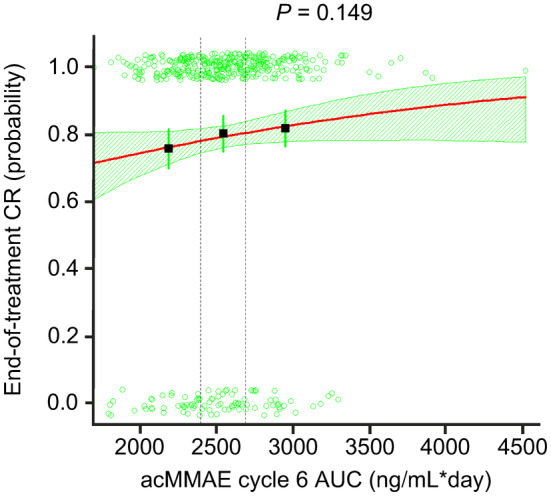
FIGURE 2.

Exposure–efficacy analysis. Logistic regression for CR at EOT versus acMMAE AUC. Dashed vertical lines show bounds of exposure groups. ac, antibody‐conjugated; AUC, area under the concentration–time curve; CR, complete response; EOT, end of treatment; MMAE, monomethyl auristatin E.
