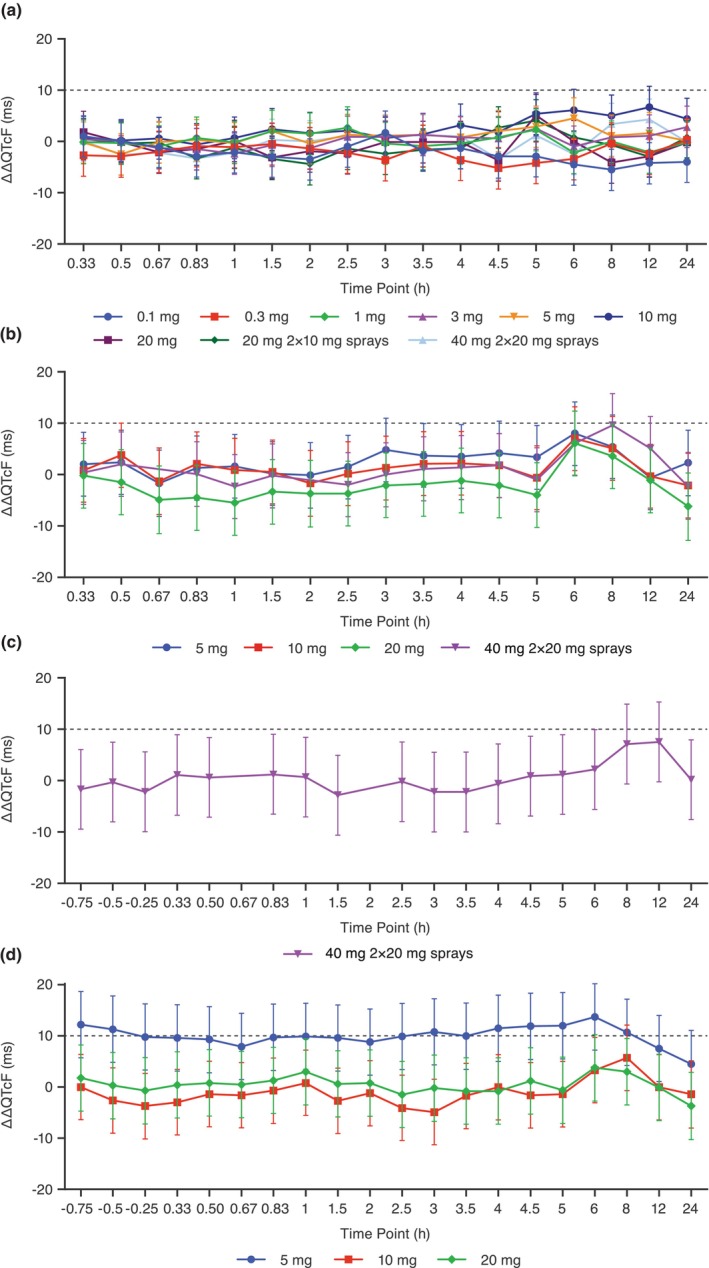
FIGURE 1.

LS mean placebo‐corrected change from baseline QTcF (ΔΔQTcF) across timepoints for the QT/QTc analysis population in the (a) SAD study and on (b) Day 1, (c) Day 8, and (d) Day 14 in the MAD study. Points and error bars represent LS mean and 90% CI based on a linear mixed‐effects model. The dashed gray line represents a 10 ms increase in QTcF. CI, confidence interval; LS, least squares; MAD, multiple‐ascending dose; SAD, single‐ascending dose; ΔΔQTcF, placebo‐corrected change from baseline QT interval corrected using Fridericia's formula.
