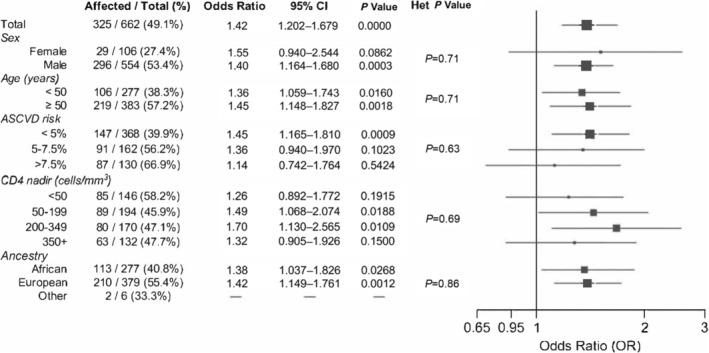
Figure 2. Associations between GPSMult and plaque presence, by participant subgroups.

Among participants with CCTA measurements, the table (left) and forest plot (right) show the OR and associated P value for the association between CAD PRS and presence of plaque. Plot includes the OR after categorizing participants on the basis of sex, age, 10‐year ASCVD risk, nadir CD4 count, and ancestry. Het P Value lists the P values from the multiple‐degrees‐of‐freedom test for heterogeneity for different subgroup ORs of each category. ASCVD indicates atherosclerotic cardiovascular disease; CAD, coronary artery disease; CCTA, coronary computed tomography angiography; OR, odds ratio; and PRS, polygenic risk score.
