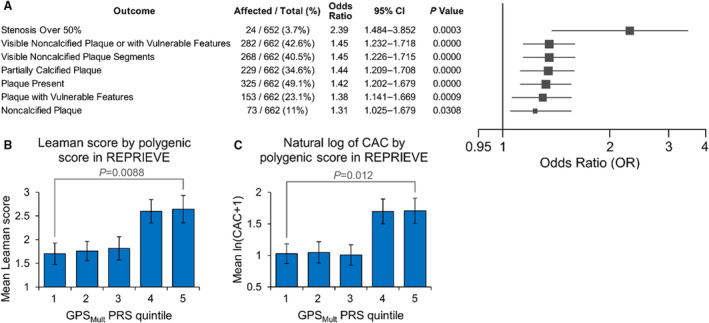
Figure 3. Associations between GPSMult and different measures of subclinical CAD.

A, Among participants with CCTA measurements, the table (left) and forest plot (right) show the OR and associated P value for the association between CAD PRS and different measures of subclinical CAD along each row. Vulnerable plaque features include napkin‐ring sign, low attenuation plaques, and positive remodeling. The mean of the Leaman score (B) and natural logarithm (ln) of theCAC score+1 (C), by quintile of GPSMult. Error bars correspond to the standard error. Significant difference in Leaman score and ln(CAC+1) between the top and bottom quintiles of PRS (P=0.0088 and P=0.012, respectively), with the Wilcoxon rank‐sum test. CAC indicates coronary artery calcium; CAD, coronary artery disease; CCTA, coronary computed tomography angiography; OR, odds ratio; PRS, polygenic risk score; and REPRIEVE, Randomized Trial to Prevent Vascular Events in HIV.
