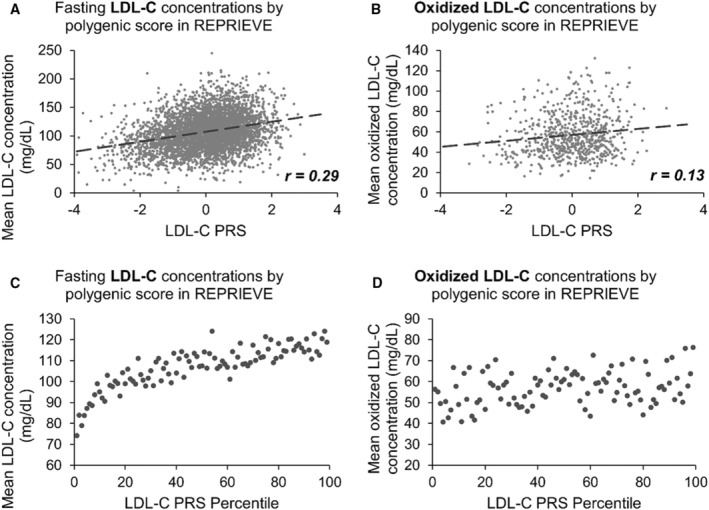
Figure 5. Associations between LDL‐C PRS and LDL‐C or oxidized LDL‐C concentrations.

A, Plot of the baseline LDL‐C concentration (mg/dL) with corresponding LDL‐C PRS for each participant (x axis). Correlation coefficient of 0.29. B, Plot of the baseline oxidized LDL‐C concentration (mg/dL) with corresponding LDL‐C PRS for each participant (x axis). Correlation coefficient of 0.13. C, Plot of the mean baseline LDL‐C concentration (mg/dL), among participants in each LDL‐C PRS percentile (x axis). D, Plot of the mean baseline oxidized LDL‐C concentration (mg/dL), among participants in each LDL‐C PRS percentile (x axis). HDL‐C indicates high‐density lipoprotein cholesterol; LDL‐C, low‐density lipoprotein cholesterol; PRS, polygenic risk score; and REPRIEVE, Randomized Trial to Prevent Vascular Events in HIV.
