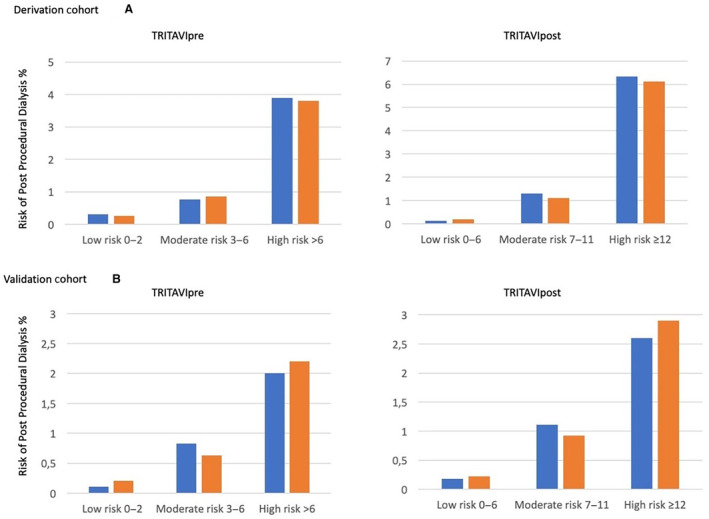
Figure 3. Assessment of goodness of fit in the 3 risk groups for the derivation cohort (A) and the validation cohort (B).

The observed and predicted rates of postprocedural dialysis for TRITAVIpre risk score in the derivation and validation cohorts showed a Hosmer‐Lemeshow goodness of fit: P=0.31 in the derivation (A) and P=0.25 in the validation group (B). Need for dialysis increased gradually in particular in the highest of 3 risk score groups (from 0.3% to 3.9%). The observed and predicted rates of postprocedural dialysis for TRITAVIpost score in the derivation and validation cohorts showed a Hosmer‐Lemeshow goodness of fit: P=0.58 for the derivation (A) and P=0.84 for the validation group (B). Need for dialysis increased in particular in the highest of the 3 score groups (from 0.1% to 6.2%). The corresponding risk score thresholds for each risk group were ≤2, 3 to 6, and >6 in TRITAVIpre, and ≤6, 7 to 11, and ≥12 in TRITAVIpost. Blue bars indicate observed values and orange bars indicate predicted values. TRITAVI indicates transfusion requirements in transcatheter aortic valve implantation.
