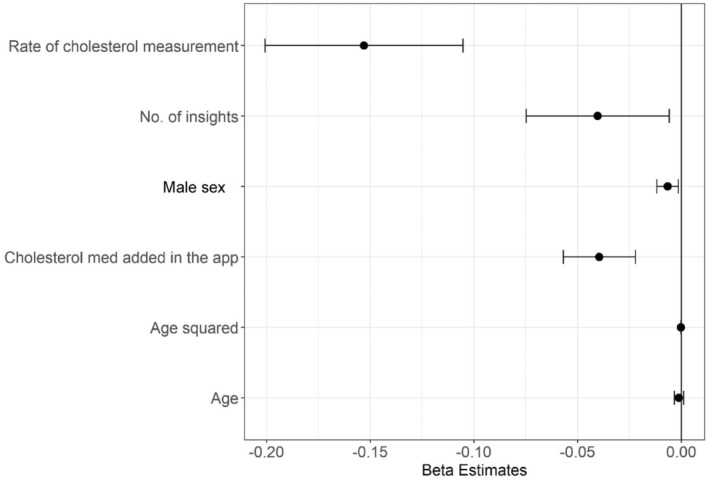
Figure 4. Estimates for variables associated with change in LDL cholesterol.

Dots represent estimates, and bars represent 95% CIs. App indicates application; and med, medication.

Dots represent estimates, and bars represent 95% CIs. App indicates application; and med, medication.