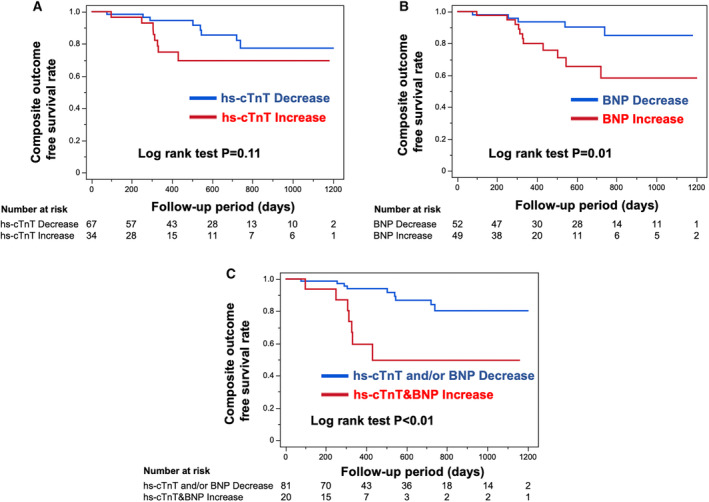
Figure 3. Kaplan‐Meier survival analysis for composite outcome‐free survival rate during the follow‐up period stratified by cardiac biomarker change during the first year after tafamidis administration.

(A and B) Kaplan‐Meier survival analysis for composite outcome‐free survival rate divided by an increase and decrease in the levels of high‐sensitivity cardiac troponin T (hs‐cTnT) (A) and B‐type natriuretic peptide (BNP) (B). (C) Kaplan‐Meier survival analysis for composite outcome‐free survival rate stratified by an increase in the levels of both hs‐cTnT and BNP and decrease in hs‐cTnT and BNP level. The number at risk is shown below each curve.
