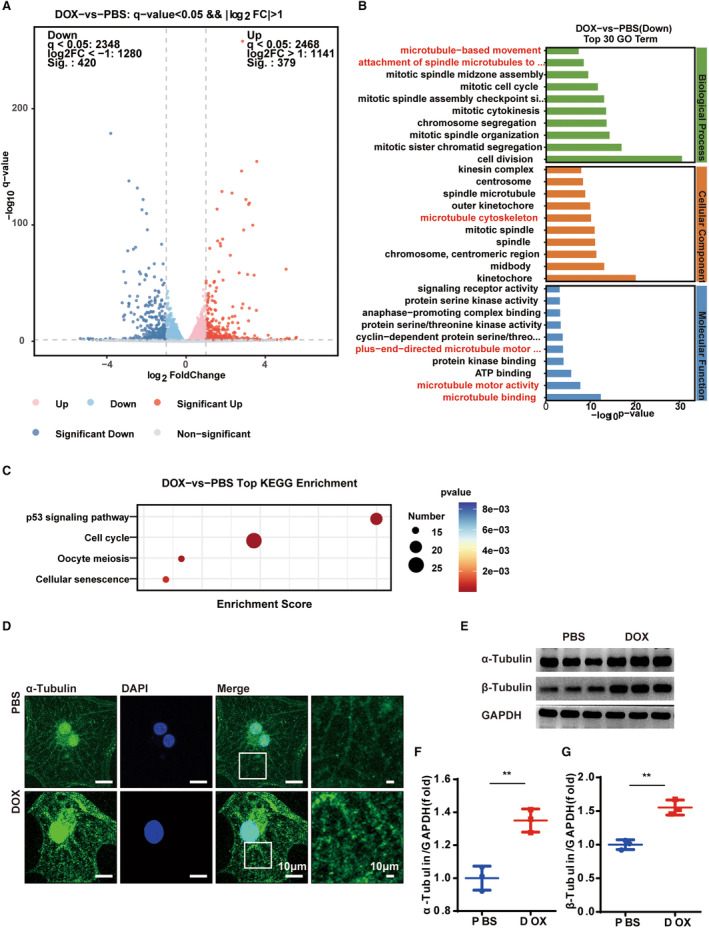
Figure 2. Doxorubicin damages the microtubule network in hiPSC‐CMs.

A, Volcano plot of the differentially expressed genes. B and C, GO and KEGG enrichment analysis of the PBS‐ and doxorubicin‐treated hiPSC‐CMs. N=3 per group. D, Representative images of the α‐tubulin immunocytochemistry staining for labeling the microtubule network. Similar results were found in more than 3 different repeats for each group. E, Representative WB analysis of α‐ and β‐tubulin. F and G, Quantitative analysis of α‐ and β‐tubulin (n=3 per group), means±SD, 2‐tailed Student t test, P>0.05, nonsignificant (ns), *P<0.05, **P<0.01, ***P<0.001, ****P<0.0001. GO indicates gene ontology; hiPSC‐CM, human‐induced pluripotent stem cell‐derived cardiomyocyte; KEGG, Kyoto Encyclopedia of Genes and Genomes; and WB, Western blot.
