
Figure 3. Colchicine bidirectionally regulates autophagy in hiPSC‐CMs.
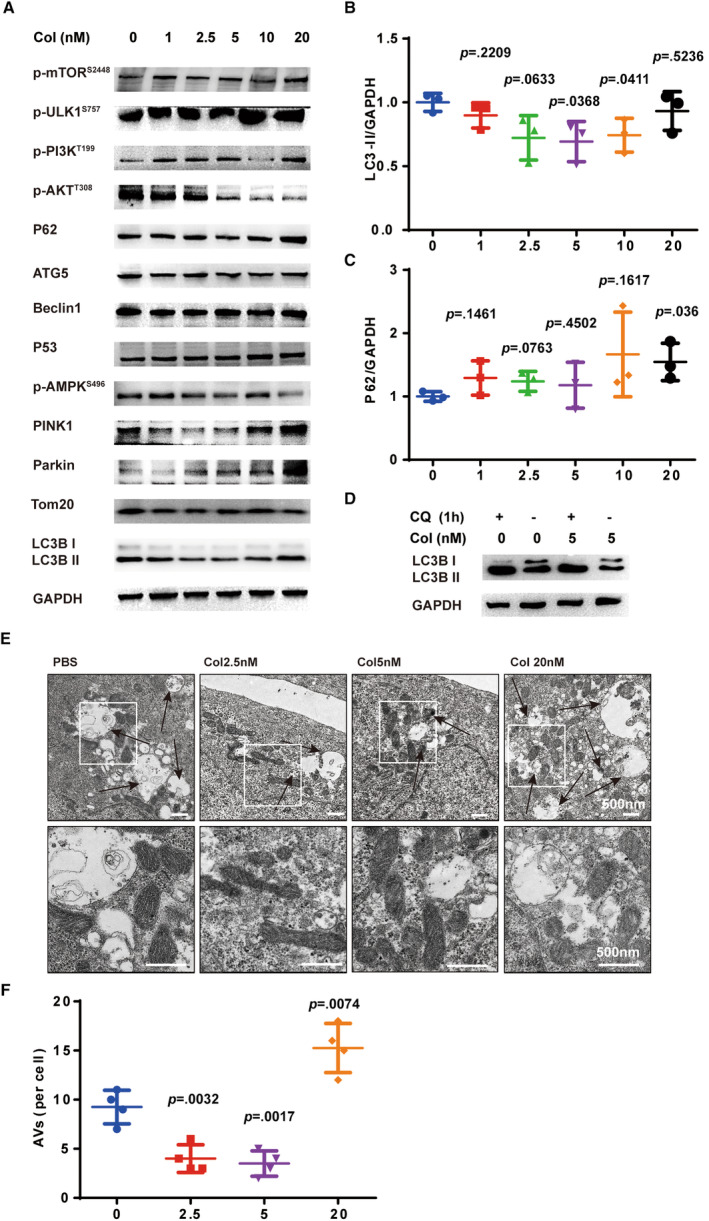
A, Representative WB analysis of a panel of autophagy associated with proteins. B and C, Quantification of the expression of P62 and LC3B‐II (n=3 per group). D, Representative WB analysis of LC3B‐II treated with +/− colchicine (5 nmol/L, 48 h), +/− chloroquine (10 μmol/L, 1 h). Similar results were found in more than 3 different repeats for each group. E, Representative TEM images for labeling AVs and mitochondria under different doses of colchicine. F, Measurements of AVs per cell (3 random fields per sample, n=4 per group). Means±SD, 2‐tailed Student t test comparing with the colchicine (0 nmol/L group). AVs indicates autophagic vacuoles; hiPSC‐CM, human‐induced pluripotent stem cell‐derived cardiomyocyte; TEM, transmission electron microscopy; and WB, Western blot.