
Figure 4. Colchicine attenuates the doxorubicin induced autophagy blocking in hiPSC‐CMs.
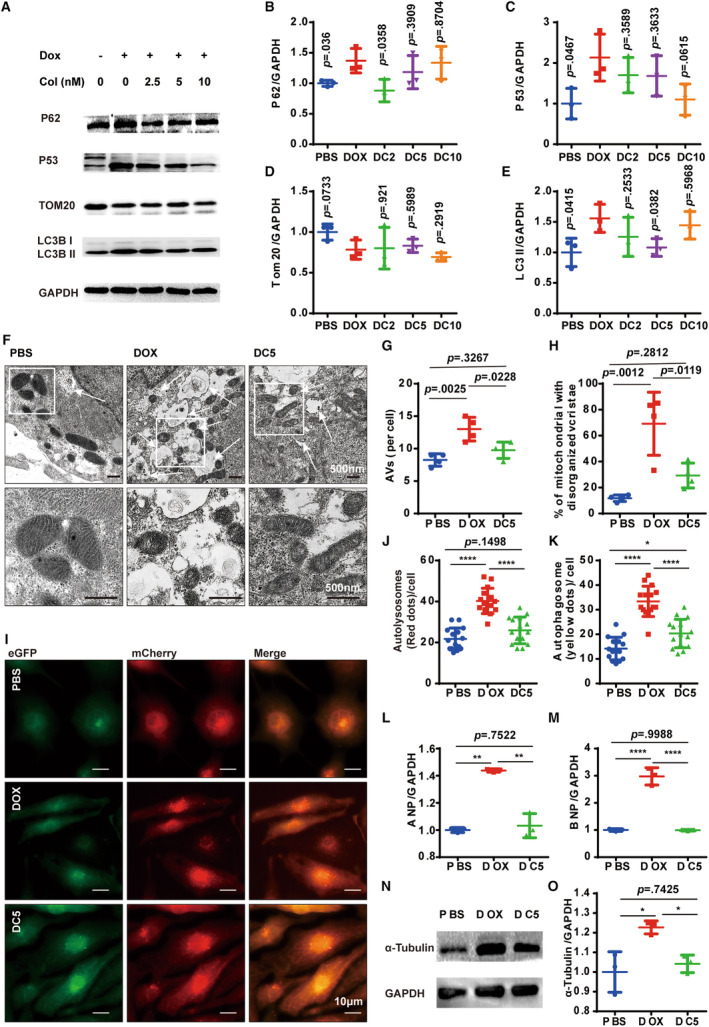
A, Representative WB analysis of a panel of autophagy associated with proteins. B through E, Quantification of the expression of P62, P53, Tom20, and LC3B‐II (n=3 per group). F through H, Representative TEM image and quantification analysis of AVs and mitochondria in different groups (3 random fields per sample, n=4 per group). I, Representative images of mCherry‐eGFP‐LC3 puncta in different groups. J and K, Measurements of the number of LC3‐positive autophagosomes and autolysosomes per cell (n=15 per group). L and M, Quantitative PCR analysis of ANP and BNP mRNA expression (n=4 per group). For B through E, 2‐tailed Student t test comparing with the doxorubicin group; N and O. Representative WB analysis of α‐tubulin (n=3 per group). G through O, 1‐way ANOVA (Tukey post test). P>0.05, values are presented, *P<0.05, **P<0.01, ***P<0.001, ****P<0.0001. AVs indicates autophagic vacuoles; DC, doxorubicin+different concentrations of colchicine (nmol/L); eGFP, enhanced green fluorescent protein; hiPSC‐CM, human‐induced pluripotent stem cell‐derived cardiomyocyte; PCR, polymerase chain reaction; TEM, transmission electron microscopy; and WB, Western blot.