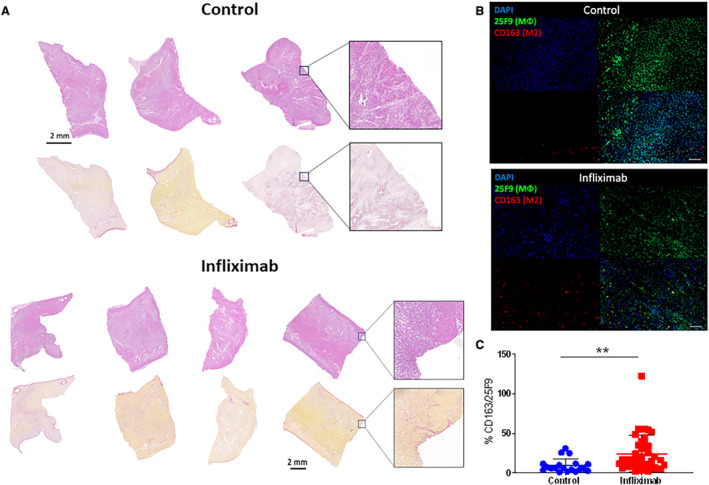
Figure 8. Histological profiling of the infarct border zone in early phase myocardial infarction.

A, Hematoxylin and eosin and Sirius Red staining of the infarction border of control (n=3) and infliximab‐treated (n=4) cohorts reveals a similar pattern of injury at day 3. B and C, Immunofluorescence staining analysis of the infarct border zone showing percentage of M2 macrophages (CD163) compared with total mature macrophages (25F9). Immunofluorescence visualization of macrophage populations with 25F9 (green: total population) vs CD163 (red: M2 population) revealed a significant upregulation of M2 cells following infliximab treatment. Scale bar: 100 μm. Data reported as mean±SD. Asterisks indicates statistical significance.
