Figure 3.
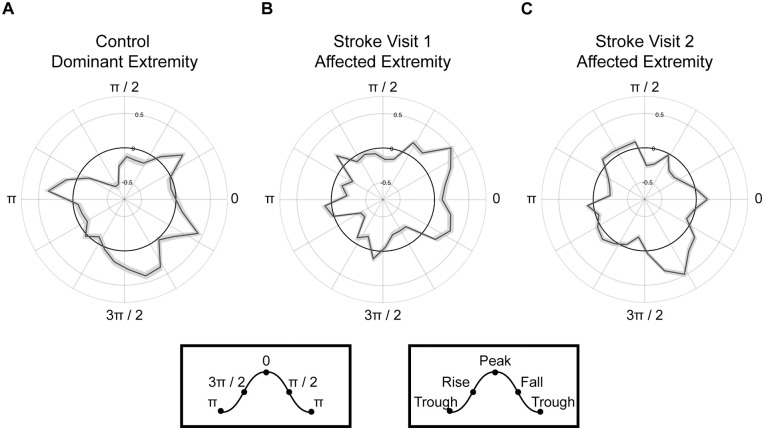
Stroke shifts M1 beta amplitude to the rise of PFC delta phase. Rose plots of PFC delta phase coupled to M1 beta amplitude (black line) in (A) control participants during task performance with the dominant extremity, (B) individuals with stroke during task performance with the affected extremity at visit 1 and visit 2 (C). A shift in phase-dependency from the peak of the delta PFC phase to the rise of the delta PFC phase occurred between visits 1 and 2. Grey shading around the black line indicates standard error. Peak and trough values in radians provide additional orientation.

