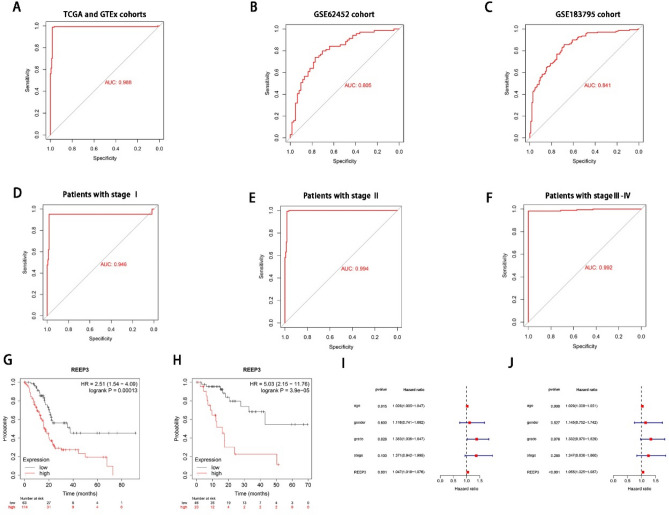
Figure 2.
Potential clinical value of REEEP3 in pancreatic cancer patients. ROC curves of REEP3 expression in TCGA, GTEx and GEO cohorts (A–C). ROC curves of REEP3 expression in TCGA cohort with different pathological stages (D–F).The Kaplan–Meier curves about the correlation between REEP3 expression and overall survive of all patients (G).The Kaplan–Meier curves about the correlation between REEP3 expression and Relapse free survival of all patients (H). Univariate and multivariate Cox analyses of REEP3 and pathological characteristics (I,J).

