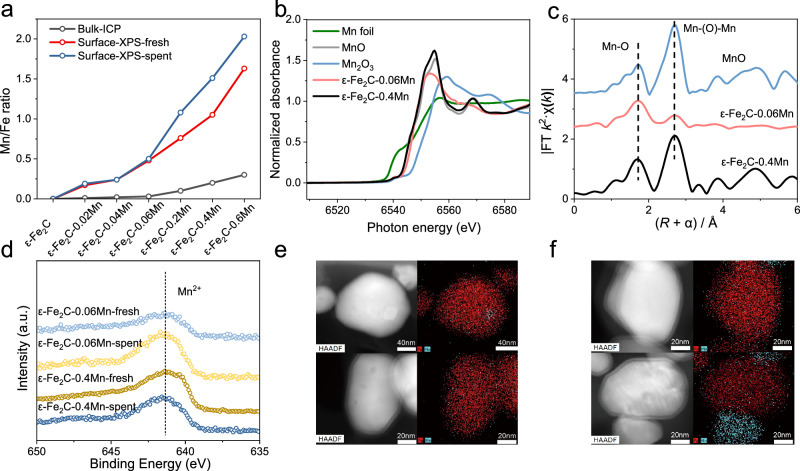
Fig. 4. Structural characterization of the manganese promoter.
a Surface and bulk Mn/Fe ratio of catalysts with various levels of manganese. Manganese K-edge XANES spectra b and EXAFS spectra c of ε-Fe2C-xMn catalysts, with Mn2O3, MnO and Mn foil as references. d Mn 2p XPS spectra of ε-Fe2C-xMn catalysts. e HAADF and STEM-EDS elemental mapping images of ε-Fe2C-0.06Mn after the FTS reaction. f HAADF and STEM-EDS elemental mapping images of ε-Fe2C-0.4Mn after the FTS reaction.

